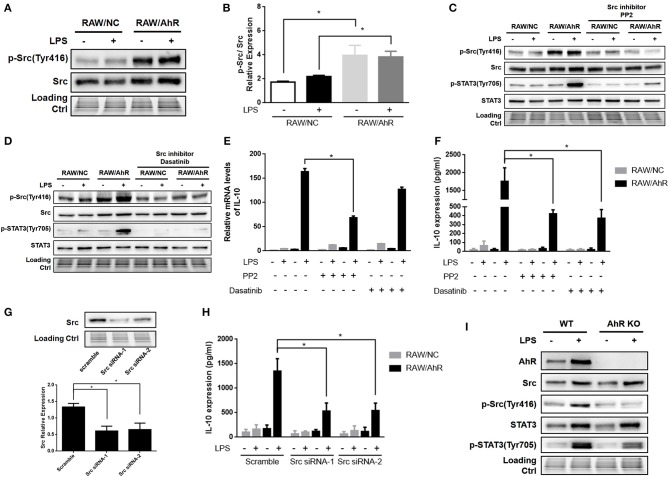
Figure 5.
AhR upregulated LPS-induced IL-10 expression through Src pathway in macrophages. (A,B) RAW/NC and RAW/AhR cells were untreated or treated with LPS for 1 h and cell lysates then subjected to western blotting analysis with anti-phosphotyrosine Src and Src antibodies. (B) Densitometric analysis of relative abundances of phospho-Src normalized to total Src. Combined results are compared using one-way ANOVA test (n = 3; control, P = 0.012; LPS, P = 0.039). (C–F) Cells were pre-treated with two different Src inhibitors (PP2 and dasatinib) for 1 h and then stimulated with or without LPS for the indicated times. (C,D) Whole-cell extracts were immunoblotted with specific antibodies. (E) IL-10 mRNA levels were detected with qRT-PCR. Combined results are compared using one-way ANOVA test (n = 3; PP2, P = 0.015). (F) IL-10 protein levels were detected with ELISA. Combined results are compared using one-way ANOVA test (n = 3; PP2, P = 0.003; dasatinib, P = 0.002). (G,H) Cells were transfected with scrambled or Src-specific siRNA and then incubated with or without LPS for 12 h. Whole-cell lysates were subjected to western blotting analysis. Combined results are compared using one-way ANOVA test (n = 4; siSrc-1, P = 0.003; siSrc-2, P = 0.004). IL-10 levels in the supernatant were determined with ELISA. Combined results are compared using one-way ANOVA test (n = 3; siSrc-1, P = 0.011; siSrc-2, P = 0.011). (I) Peritoneal macrophages isolated from WT or AhR-KO mice were stimulated with or without LPS for 6 h. Whole-cell lysates were subjected to western blot analysis. Western blot images are representative of three independent experiments. Data in all bar graphs are mean ± SEM of three independent experiments. Differences were analyzed with one-way ANOVA. *P < 0.05.

