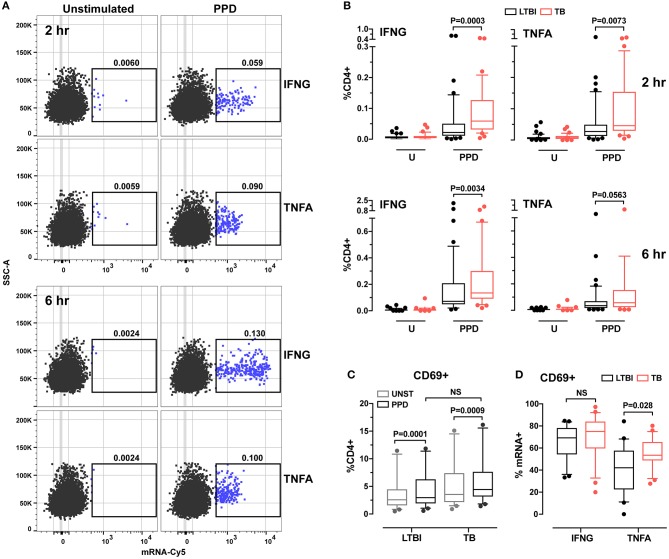
Figure 1.
Analysis of cytokine expression and cell activation in CD4+ T cells from LTBI and active TB donors. (A) Representative dot plots of IFNG and TNFA cytokine expression in CD4+ T cells after 2 and 6 h in vitro stimulation. PBMC were stimulated for 2 and 6 h with PPD or left unstimulated. After stimulation samples were stained for surface markers and hybridized with IFNG or TNFA mRNA probes. Frequencies of CD4+ cytokine mRNA+ cells are reported above each gate. (B) Cytokine expression in CD4+ cells. Data are expressed as the frequencies of CD4+ T cells expressing IFNG or TNFA mRNA at each time point. LTBI n = 47, TB n = 34. (C) CD69 expression in unstimulated and PPD stimulated CD4+ T cells for 2 h. Data were expressed as frequency of CD4+ T cells. LTBI n = 24, TB n = 22. Gating strategy is described in Supplementary Figure 1C (upper panel). Outliers above 20% (one per group) were removed to allow for better data representation. (D) CD69 expression in IFNG and TNFA mRNA+ CD4+ T cells. Data were expressed as frequency of total IFNG+ or TNFA+ cells after 2 h of PPD stimulation. LTBI n = 24, TB n = 22. Gating strategy is described in Supplementary Figure 1C (lower panel). The Wilcoxon two-sample test was used to analyze differences between LTBI and active TB donors. The box plots show lower quartile, median, and upper quartile of the distribution. The upper and lower whiskers represent the 90th and 10th percentile. Extreme values (below the 10th percentile and above the 90th percentile) are shown as (•) symbol.

