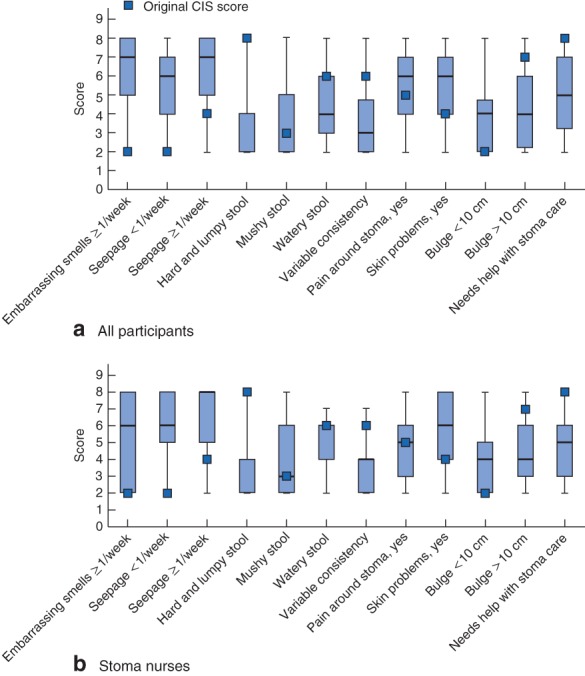
Figure 5.

Score assigned by a all participants and b stoma nurses for each of the 12 responses to the seven factors in the Colostomy Impact Score (CIS) compared with original scores. Median values, interquartile ranges and ranges are denoted by bars, boxes and error bars respectively for every response value scored in step 2. The pattern was similar for all participants and stoma nurses
