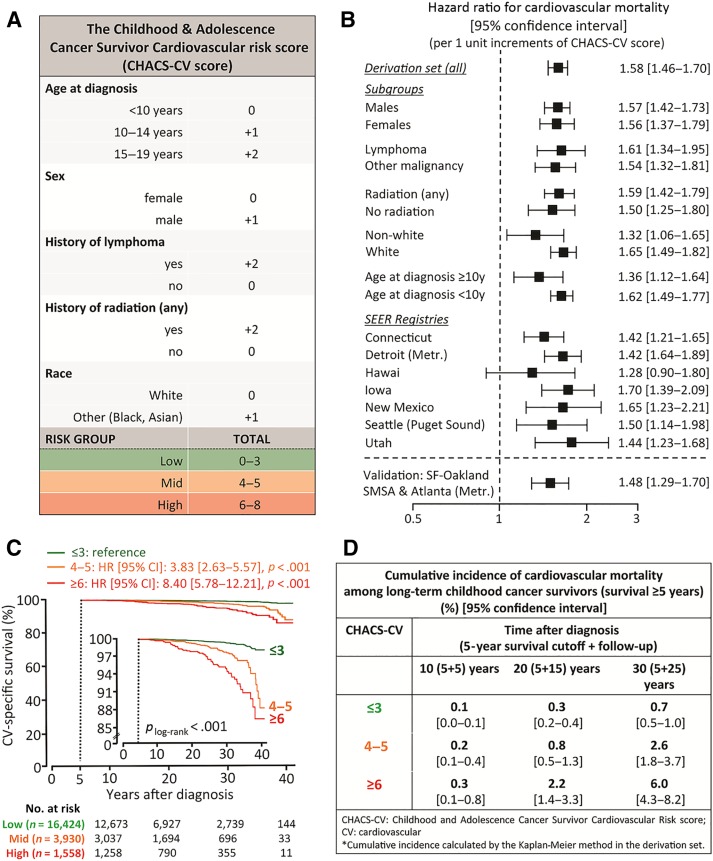
Figure 3.
The CHACS‐CV risk score. A clinical risk score of cardiovascular mortality was created by assigning one or two points to clinical variables that were independently associated with cardiovascular mortality (A). The sum of all points was then defined as the CHACS‐CV risk score (range 0–8). CHACS‐CV was predictive of cardiovascular mortality both in the overall derivation group and in the subgroup analysis per age, sex, race, history of radiation, and malignancy type (B). Long‐term survivors were then stratified in three distinct risk groups (high risk if CHACS‐CV ≥ 6; mid risk if CHACS‐CV = 4–5, and low risk if CHACS‐CV ≤ 3; C). Compared with the low‐risk group, those in the high‐risk and mid‐risk groups had an eightfold and an almost fourfold higher risk of cardiovascular mortality, respectively. Twenty‐five‐year cumulative incidence of CVM (calculated after the 5‐year survival cutoff) was found to be 6.0% in the high‐, 2.6% in the mid‐, and 0.7% in the low‐risk CHACS‐CV groups, respectively (plog‐rank < .001; D).
Abbreviations: CHACS‐CV, Childhood and Adolescence Cancer Survivor CardioVascular; CI, confidence interval; HR, hazard ratio; Metr, metropolitan; SEER, Surveillance, Epidemiology, and End Results; SF, San Francisco; SMSA, Standard Metropolitan Statistical Area; y, years.

