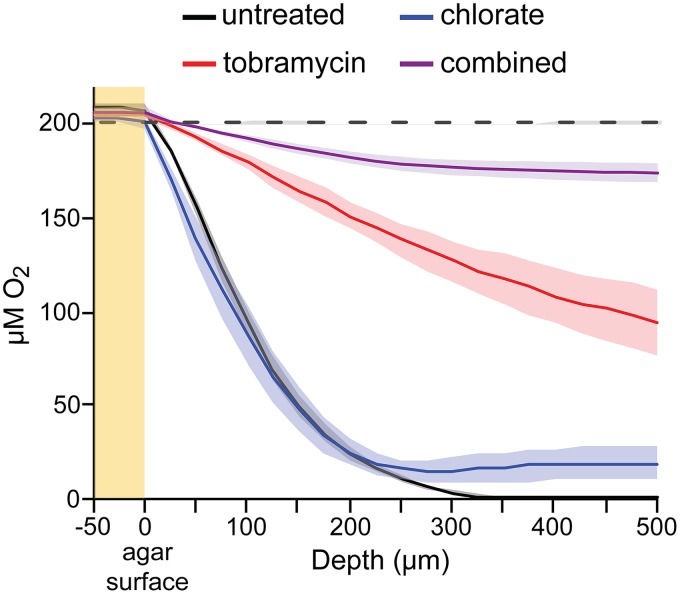
FIG 6.
Oxygen profiles in treated aggregate biofilm populations. Oxygen profiles of P. aeruginosa aggregate biofilms after a 6-h incubation without a treatment (black) or with 40 μg/ml tobramycin (red), 10 mM chlorate (blue), or 40 μg/ml tobramycin plus 10 mM chlorate (combined; purple). The yellow region highlights measurements taken above the surface of the agar, and the dashed black line shows oxygen profiles from uninoculated agar samples. Data show the means from 3 independent experiments, and colored regions indicate standard errors.

