Figure 3.
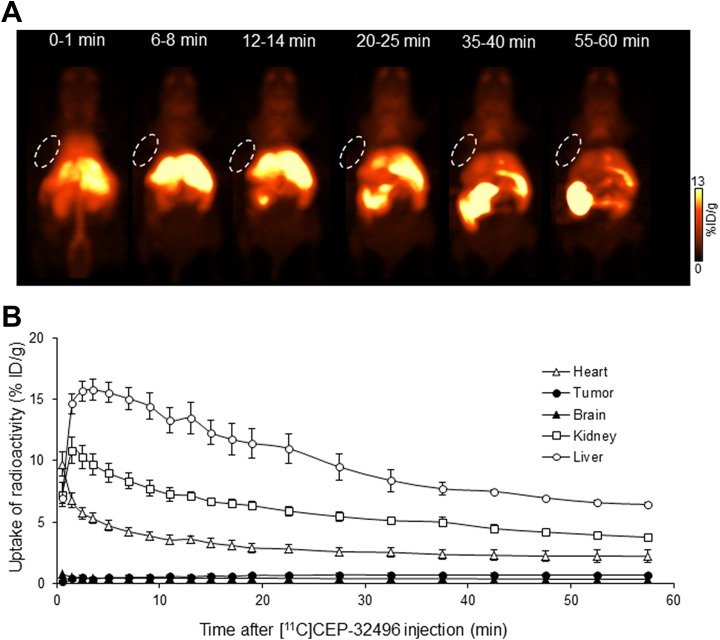
Representative pharmacokinetic images and quantification of [11C]CEP-32496 in nude mice-bearing A375 xenografts. A, Representative maximum intensity projection images summed from scans during different time points after [11C]CEP-32496 injection. White circles indicate tumors. B, Time–activity curves (TACs) of [11C]CEP-32496 in the heart, tumor, brain, kidney, and liver. Data are expressed as means ± standard error of mean (SEM) from 4 tumor-bearing mice per group.

