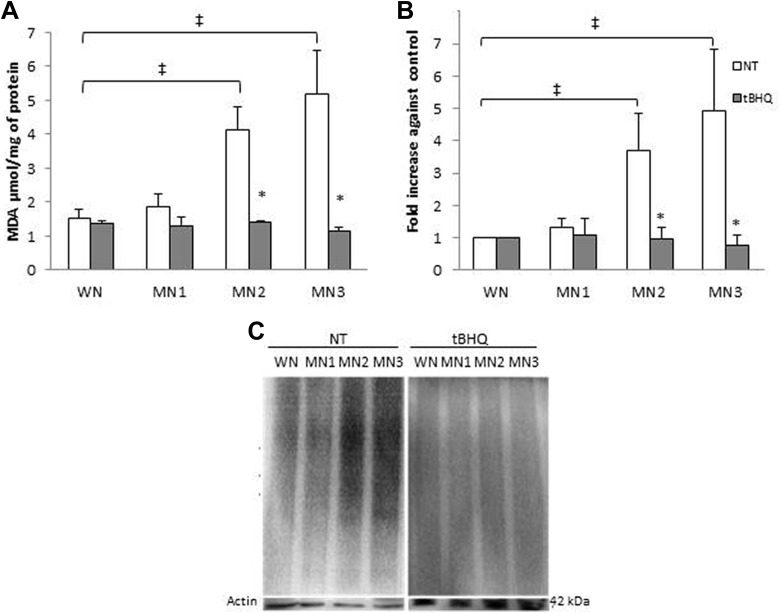
Figure 2.
Lipid peroxidation and protein oxidation obtained from t-BHQ and NT, WN, and MN rats. A, Lipid peroxidation. B, Protein oxidative damage, densitometric analysis. C, Representative Oxyblot; actin was used as an internal control. Each point represents the mean ± SE. *P < .05 statistical significance between MN-t-BHQ groups in relation to their MN-NT group. ‡ P < .05 statistical differences between MN-NT groups versus WN-NT. NT indicates nontreated; SE, standard error; t-BHQ, tert-butylhydroquinone.

