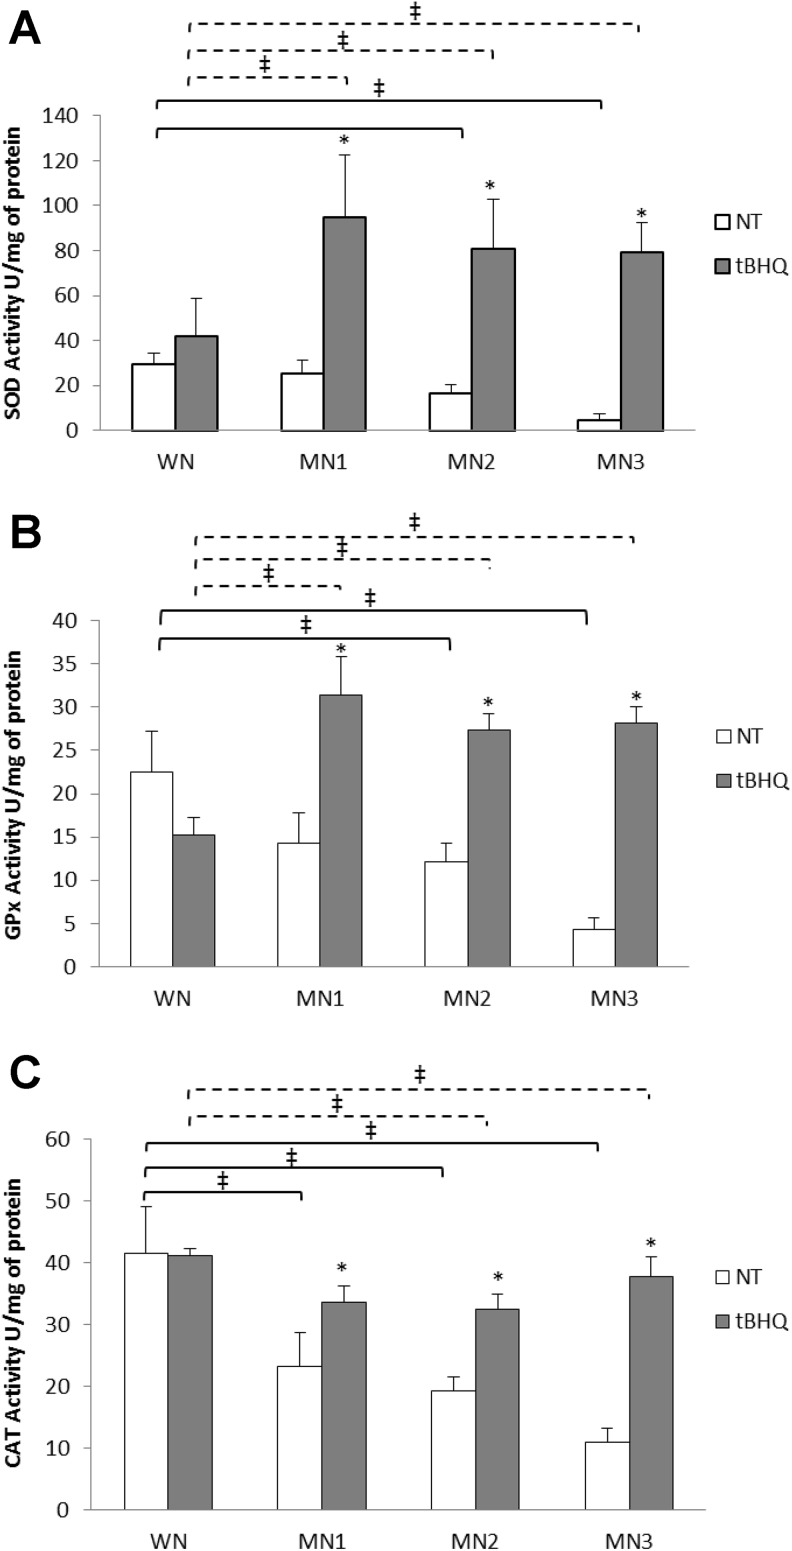
Figure 4.
Figure shows the enzymatic activity for (A) SOD, (B) GPx, and (C) CAT. Each point represents the mean ± SE. *P < .05 statistical significance between MN-t-BHQ groups in relation to their MN-NT group. ‡ P < .05 significant differences between MN-NT groups (black line) or MN-t-BHQ (dotted line) with respect to their WN. GPx indicates glutathione peroxidase; NT, nontreated; SE, standard error; SOD, superoxide dismutase; t-BHQ, tert-butylhydroquinone.

