Fig. 3.
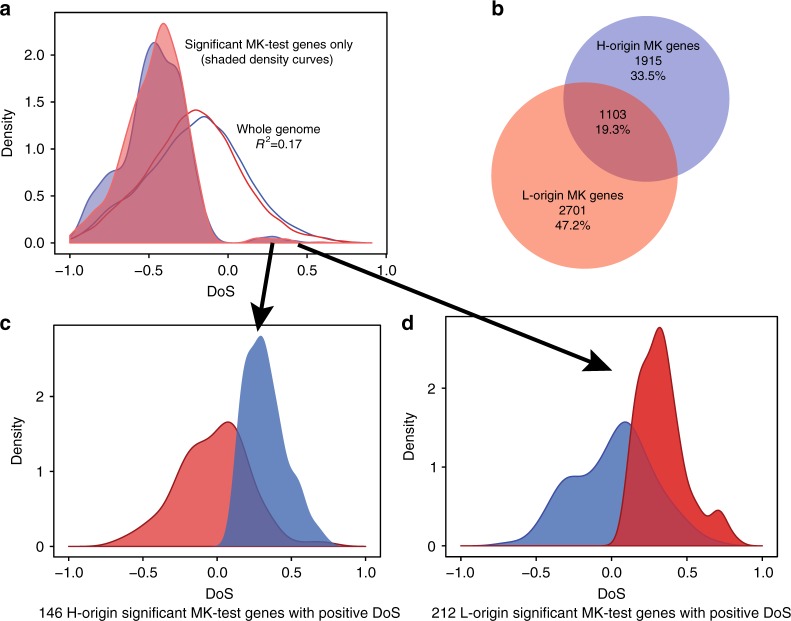
The direction of selection for both subgenomes. a Density curves of the direction of selection (DoS)14 for about 21,000 coding sequences (blue line and density curves are DoS for H-origin genes, red line and density curves are DoS for L-origin genes). Neutral genes are indicated by 0, while negative values indicate purifying selection and positive values indicate positive selection. The means of these distributions are −0.20 and −0.22 for the H- and L-origin homeologs, respectively, and show that ~70% of both homeologs have a negative selection index (negative DoS). Shaded density curves are genes that were significant for MK tests (p < 0.05 using Fisher’s marginal p-values). b Only 19% of genes show significance for MK tests for both homeologs. c Using only significant MK-test genes with positive DoS for halleri-origin and d positive DoS for lyrata-origin genes show that the other homeolog has significantly more negative DoS (p-value < 2.2e−16 using pairwise t-test and Wilcoxon signed-rank test) when one shows positive selection using comparisons of DoS distributions in both c and d

