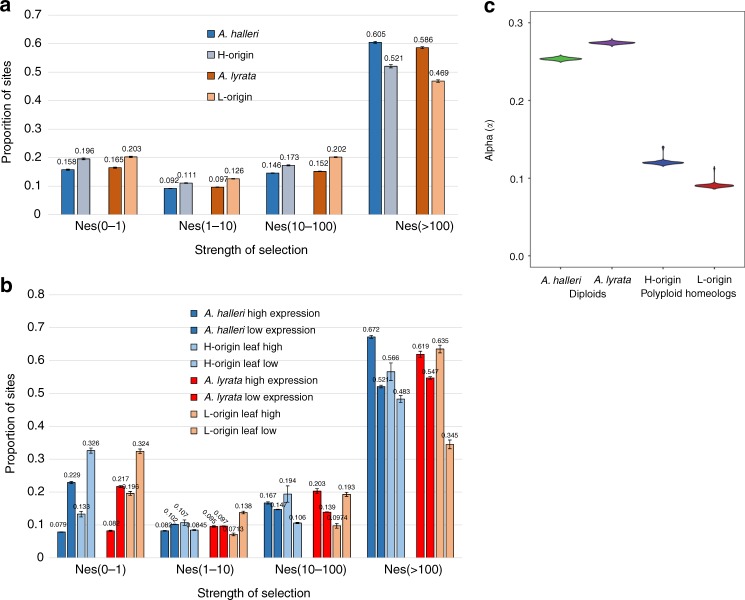
Fig. 4.
The strength of purifying selection and adaptive evolution. a The distribution of fitness effects (DFE) of deleterious mutations for coding sequences of the two A. kamchatica subgenomes and corresponding diploid orthologs of A. halleri and A. lyrata. The strength of selection is indicated by Nes where Ne is the effective population size and s is the selection coefficient. Error bars show sd. b DFE categorized by expression in both subgenomes and diploid species. Expression categories were taken from the upper 10% (high) and lower 10% (low) of expression distribution in all A. kamchatica homeologs. The DFE was estimated from 106 MCMC replicates. Error bars are sd from 1000 resampled MCMC replicates. c The proportion of adaptive non-synonymous substitutions (α) for both subgenomes (H-origin α = 0.12, CI: 0.117–0.141, L-origin α = 0.09, CI: 0.087–0.094) and for the two corresponding diploid species (A. halleri α = 0.25, CI: 0.251–0.257, A. lyrata α = 0.27, CI: 0.272–0.277) are significantly greater than zero

