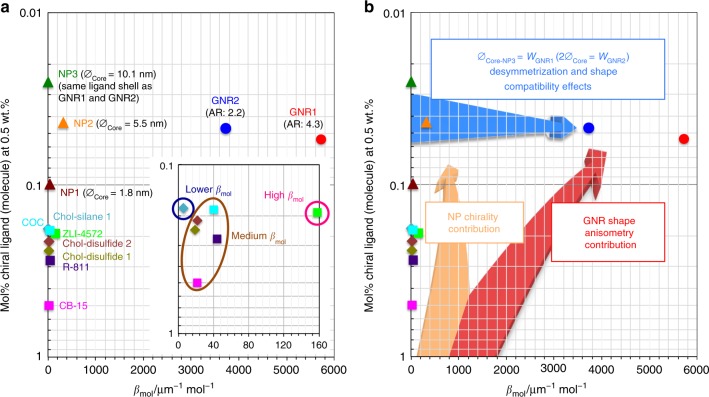
Fig. 5.
Chirality transfer efficiency. a Plot of the molar helical twisting power βmol (μm−1 mol−1) vs. the concentration (mol fraction, mol%) calculated for 0.5 wt.% of the chiral additive. Diamonds and squares represent the neat organic chiral additives (blue diamonds: Chol-silane 1, dark green diamonds: Chol-disulfide 1, brown diamonds: Chol-disulfide 2, pink squares: CB-15, light blue squares: COC, green squares: ZLI-4572, and purple squares: R811), triangles the chiral ligand-capped Au NPs (dark brown triangles: NP1, orange triangles: NP2, and green triangles: NP3), and circles the two cholesterol-functionalized GNRs (red circles: GNR1 and blue circles: GNR2). b The same plot highlighting the specific contributions of inherent NP chirality, anisometry of the GNRs and desymmetrization from chiral ligand-capped Au NPs to GNRs. Chiral correlation or persistence lengths are the lowest at the origin and highest in the top-right corner of this plot

