Fig. 6.
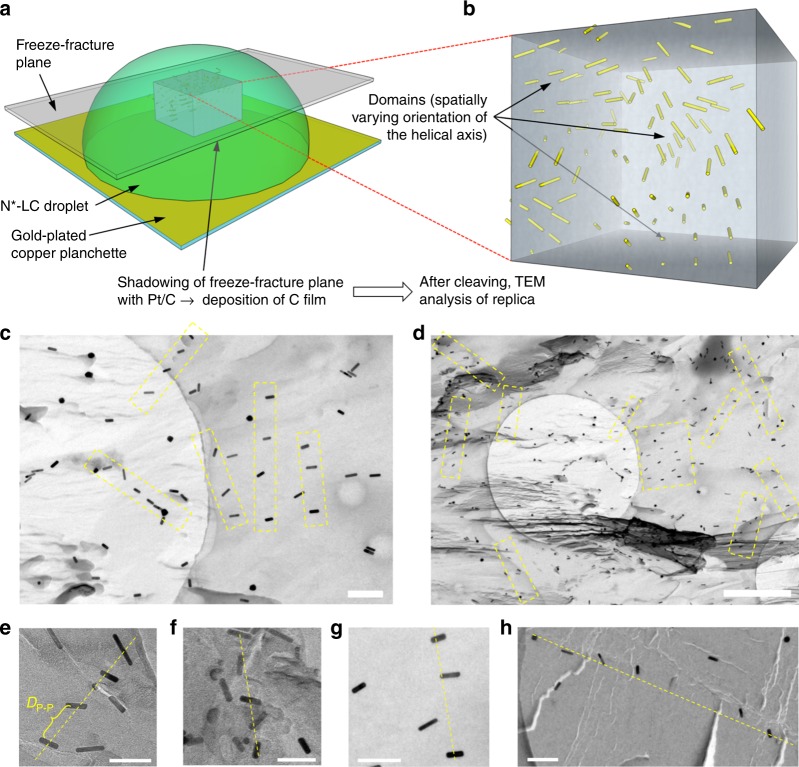
Freeze-fracture transmission electron microscopy images of induced N*-LC droplets. a Schematic depiction of the freeze-fracture method to prepare the TEM specimen. b A representative voxel of the droplet showing the multi-domain structure via the embedded GNRs. c, d FF-TEM images of the induced N*-LC phase of Felix-2900–03 containing 0.5 wt.% GNR2 (scale bars: c 200 nm and d 1 μm, apparent circles are from the TEM grids). To obtain these images, it was important that the replica captured most of the GNRs on the fractured surface, thereby providing a direct visualization of the GNRs in the bulk material. Areas highlighted by a yellow box and e–h select areas from many of the obtained FF-TEM images show GNR arrays (often twisted) with an average separation close to the calculated DP–P values (scale bars in e–h: 100 nm)

