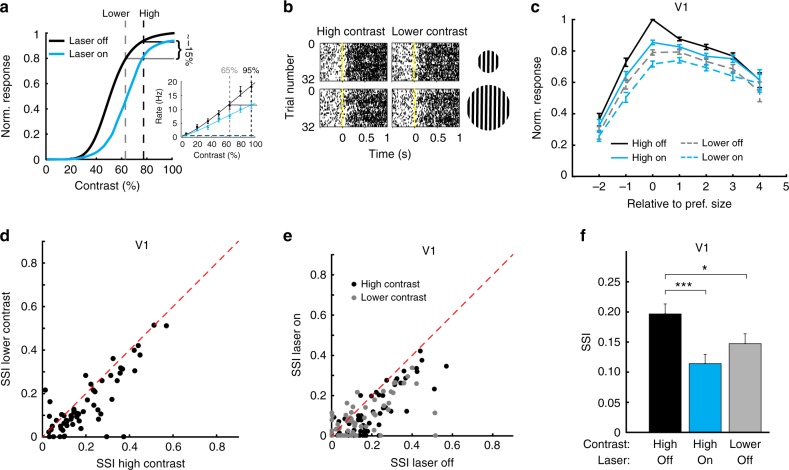
Fig. 5.
Lowering contrast reduces V1 surround suppression like optogenetically inhibiting sSC. a Contrast tuning in V1 was measured for an optimal size stimulus, without (black) and with (blue) optical inhibition of the sSC. The highest contrast at which the population response showed a reduction of approximately 15% was set as high contrast level. The contrast level at which the population gave a roughly equal response when the sSC is not inhibited was set as lower contrast level. Inset, example contrast tuning curve for one V1 unit. b Example rastergram of V1 neuron for gratings shown at two sizes at high (90%) and lower (70%) contrast. Different lines show different trials with different drifting directions. Stimulus started at time 0. c Population average size tuning curves for lower contrast resembled the size tuning curve at high contrast with optogenetic inhibition of the sSC. All responses were normalized to the response of the preferred stimulus at high contrast, without optogenetic inhibition of the sSC. Error bars indicate s.e.m. d Surround suppression was lower at lower contrast (p = 3.4 × 10⁻⁷, Wilcoxon test; 5 mice, 63 units). e Optogenetic inhibition of the sSC reduced V1 surround suppression for high and lower contrasts. f Surround suppression for high contrast without and with optogenetic inhibition of sSC and for lower contrast without optogenetic inhibition of the sSC (change by inactivating sSC, p = 0.00019; change by lowering contrast p = 0.041; difference between inactivated sSC condition and lower contrast: p = 0.19, all Bonferroni-corrected Mann–Whitney U-tests). Bars indicate mean and s.e.m.; *p < 0.05, ***p < 0.001

