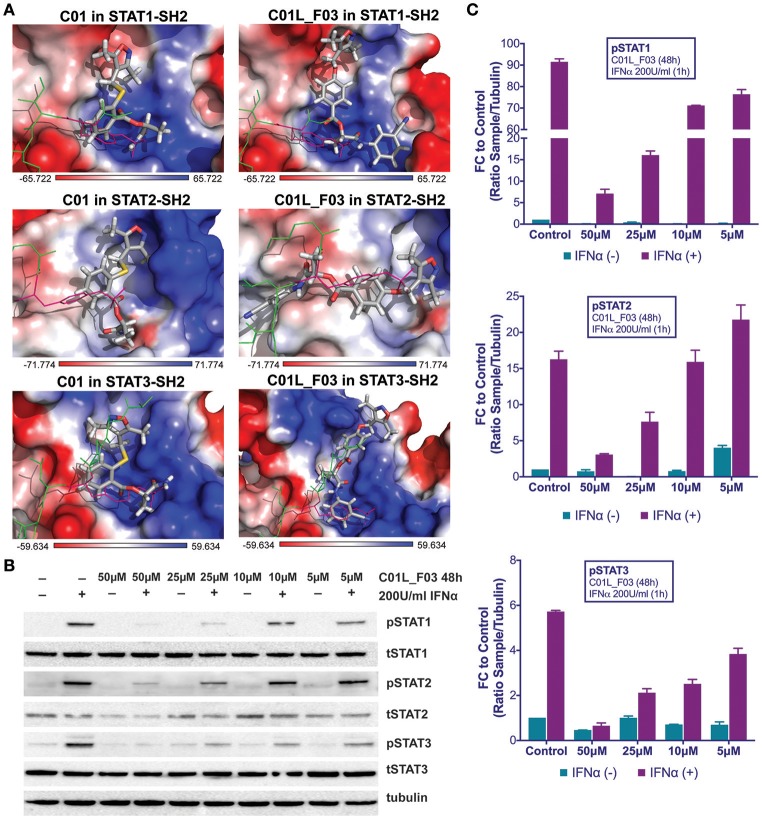
Figure 2.
Top-scored binding conformations of C01 and C01L_F03 in the SH2 domain of STAT1, STAT2, and STAT3 (A). C01 and C01L_F03 compounds are shown in stick representation and colored according to the atomic structure. pTyr-linker is represented by green lines with pink pTyr residue. SH2 domains of STAT1, 2 and 3 in the surface representation are colored based on the distribution of the APBS electrostatic surface potential (43). Positively charged regions are indicated in blue and negatively charged regions in red. Docking simulations were performed using Surflex-Dock 2.6 program (19, 20). C01L_F03 inhibits IFNα induced phosphorylation of STAT1, STAT2 and STAT3 (B). HMECs were treated with 50, 25, 10, and 5 μM C01L_F03 for 48 h and with 200 U/ml of IFNα for 1 h. Protein extracts were collected and levels of pSTAT1, pSTAT2, pSTAT3, tSTAT1, tSTAT2, tSTAT3 and α-tubulin were assessed by western blotting. Western quantification (C). Bars represent mean quantification form 3 individual repeats ± SEM as error bars.

