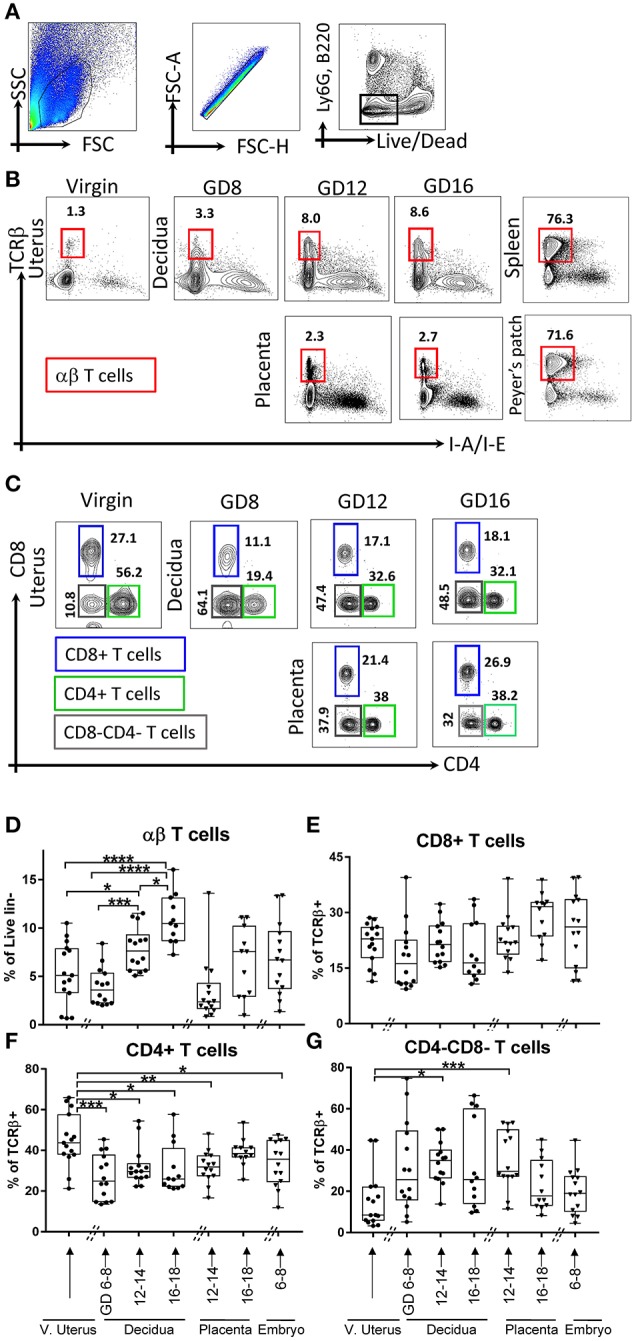
Figure 3.

Gating strategy and dynamics of αβT cells. (A,B) αβT cells, defined as lin2-[Ly6GnegB220negI-A/I-Eneg (TCRβ+)]. (B) Gating strategy of αβT cells in murine virgin uterus, decidua and placenta across the gestational age, upper panel showed decidua, lower panel showed as placenta, spleen, and Peyer's patches used as controls. (C) Gating strategy of T cells subsets, CD4+ T cells, CD8+ T cells, CD4-CD8-T cells. (D) Proportions of αβT cells out of live lin2-population. (E–G) Proportions of CD8+ T cells out of αβT cells), proportions of CD4+ T cells out of αβT cells, proportions of CD4-CD8-T cells out of αβT cells in murine virgin uterus, decidua, placenta, and embryo across gestational age. n = 11–15 (15 independent experiments), the exact number of animals was summarized in Supplementary Table 3. The data of virgin uterus were compared with decidua group or placenta (include embryo) group, respectively. Statistical analysis was performed using ANOVA followed by post-hoc Tukey analysis. *p < 0.05, **p < 0.005, ***p < 0.0005, ****p < 0.0001.
