
Figure 4.
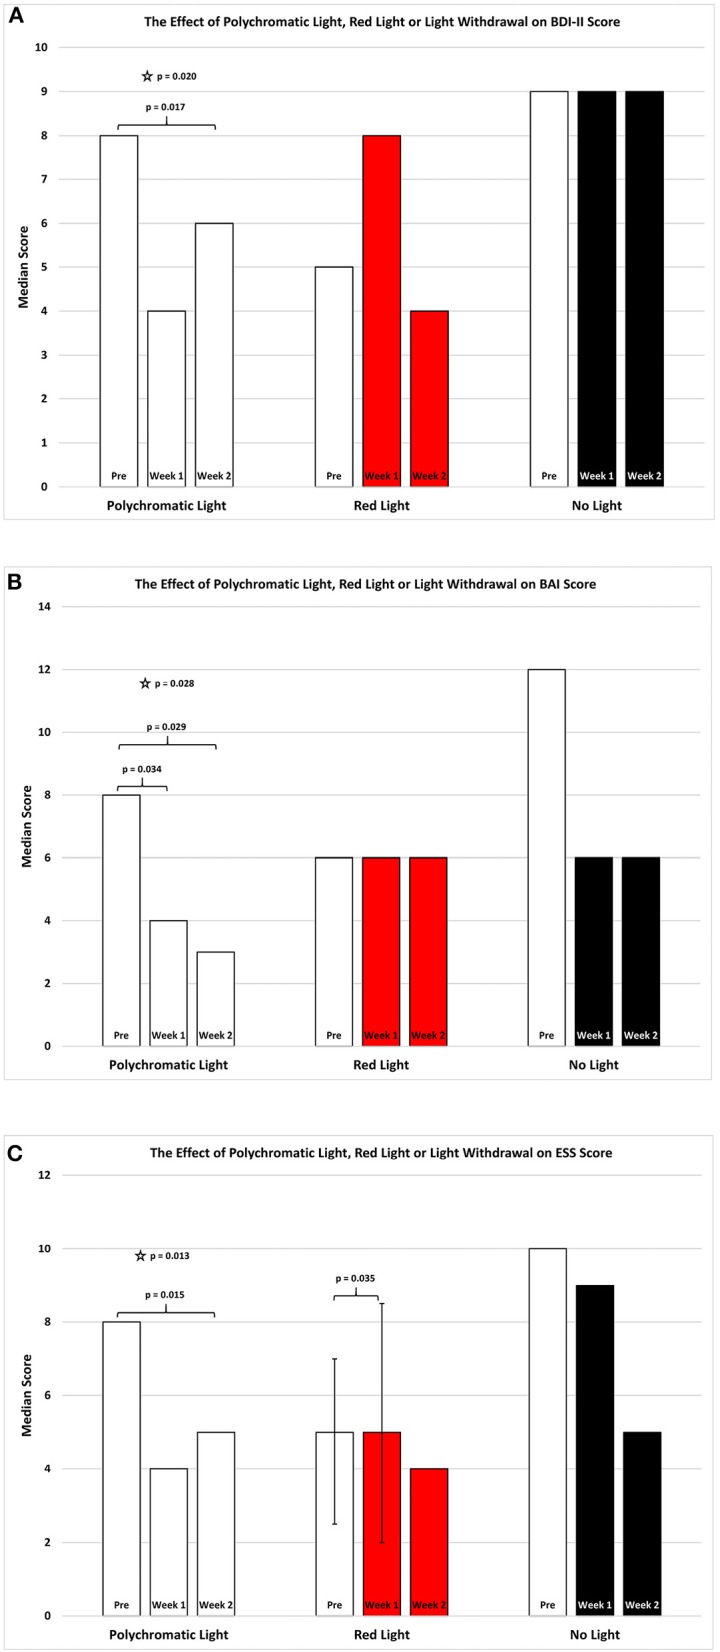
The effect of continued daily exposure to polychromatic light, red light or withdrawal of polychromatic light on the BDI-II (A), BAI (B), and the ESS (C) is expressed as the median score for each group after 3 assessments over a 2 week period. The pre-score served as the baseline and was obtained when the study commenced and before patients were randomly assigned to their respective treatment groups. The inclusion bars show significant statistical comparisons with p-values indicating the levels of significance obtained. Statistical comparisons were made between baseline (Pre) and Week 1, Pre and Week 2 and Week 1 and Week 2. Significant levels were determined a priori with p ≤ 0.05 regarded as significant while trends were designated as p-values ranging from 0.051 to 0.099. The star represents a significant overall effect using the Friedman's Two Way ANOVA while the inclusion bars mark significant comparisons using the Wilcoxon Signed Rank Test.