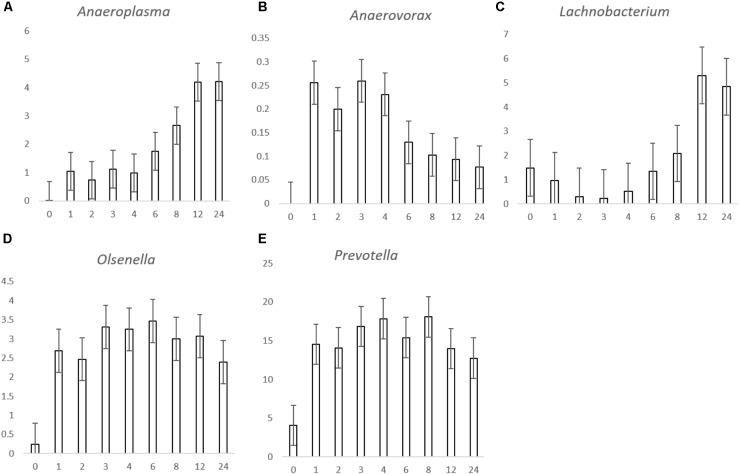
FIGURE 3.
Histograms showing the proportion of bacterial genera Anaeroplasma (A), Anaerovorax (B), Lachnobacterium (C), Olsenella (D), and Prevotella (E) attached to Lolium perenne, Lotus corniculatus, and Trifolium pratense post rumen-like in vitro incubation over time. The X axis corresponds with the number of hours post-incubation and the y axis shows the percentage of relative read abundance. Values are given as the mean of the 3 forages (n = 9) for each timepoint and error bars are given as standard error of mean.

