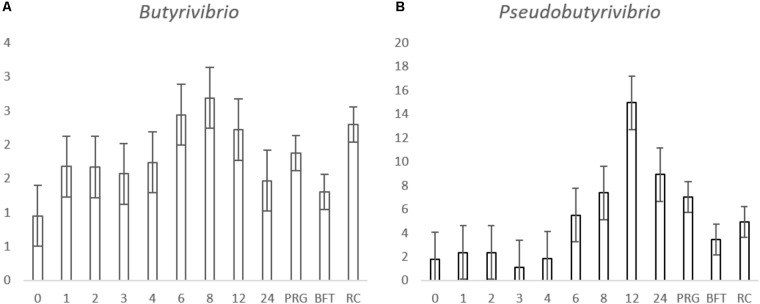
FIGURE 4.
Histograms showing the proportion of Butyrivibrio and (A), Pseudobutyvibrio (B) attached to Lolium perenne (PRG), Lotus corniculatus (BFT) and Trifolium pratense (RC) post rumen-like in vitro incubation over time. The numbers in the x axis correspond with the number of hours post-incubation and the letters correspond with the forage type comparisons. The y axis shows the percentage relative abundance. Values for the time comparison are given as the mean of the 3 forages (n = 9) at each timepoint, values for the forage type comparison are given as a mean of all time points in the forage group (n = 27) and error bars are given as standard error of mean.

