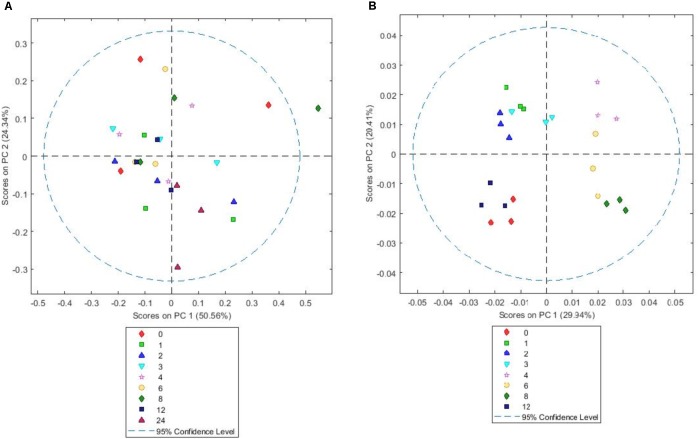
FIGURE 6.
Simple score plot (A) and GLS weighted score plot (B) of principal components PC1 vs. PC2 for an FTIR spectrum of Lolium perenne plant matter after different times (hours) of in vitro rumen incubation. Please note that 24 h data are not shown in GLS weighted plot as they were clear outliers which skewed the plot.

