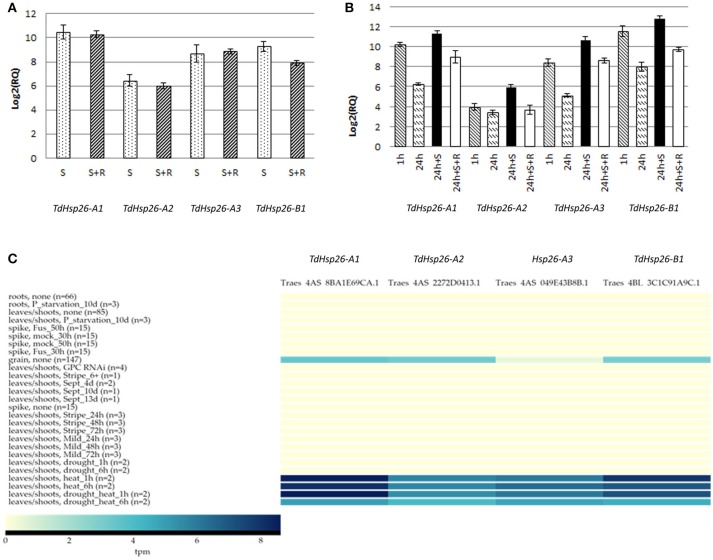
Figure 4.
Expression analysis of TdHsp26-A1Ch, TdHsp26-A2Ch, TdHsp26-A3Ch, and TdHsp26-B1Ch genes in seedling exposed to heat stress. (A) Direct heat stress experiment; conditions: 42°C for 2 h (S) and recovery at 25°C for 2 h (S+R). (B) Heat acclimation experiment; conditions: 34°C for 1 h (1 h) and 24 h (24 h), stress at 42°C for 2 h (24 h+S), recovery at 25°C for 2 h (24 h+S+R). The induction levels are measured as the fold change (RQ) of the treated samples in respect to the controls and reported as log2(RQ) in the chart (A,B). Bars indicate the standard deviation. (C) Heat map of the expression analyses performed with ExpVIP database. The transcript abundances in leaves/shoots after 1 h/6 h heat stress, drought stress, the combination of heat and drought, and the basal expression in grain tissue in no stress condition is reported. Transcript abundances are expressed in log2(tpm, transcript per million); (n) indicates the number of RNA-seq samples included in each dataset.

