FIGURE 2.

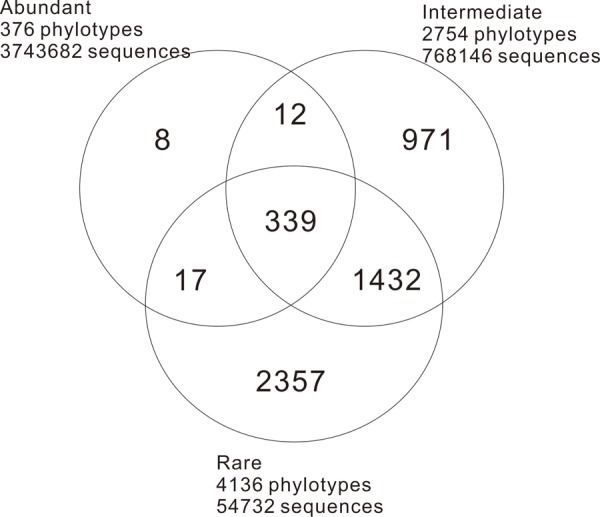
Venn diagram illustrating the distribution structure of the abundant, intermediate, and rare phylotypes (OTUs at the 97% cutoff) in the sampled hot springs.

Venn diagram illustrating the distribution structure of the abundant, intermediate, and rare phylotypes (OTUs at the 97% cutoff) in the sampled hot springs.