Figure 1.

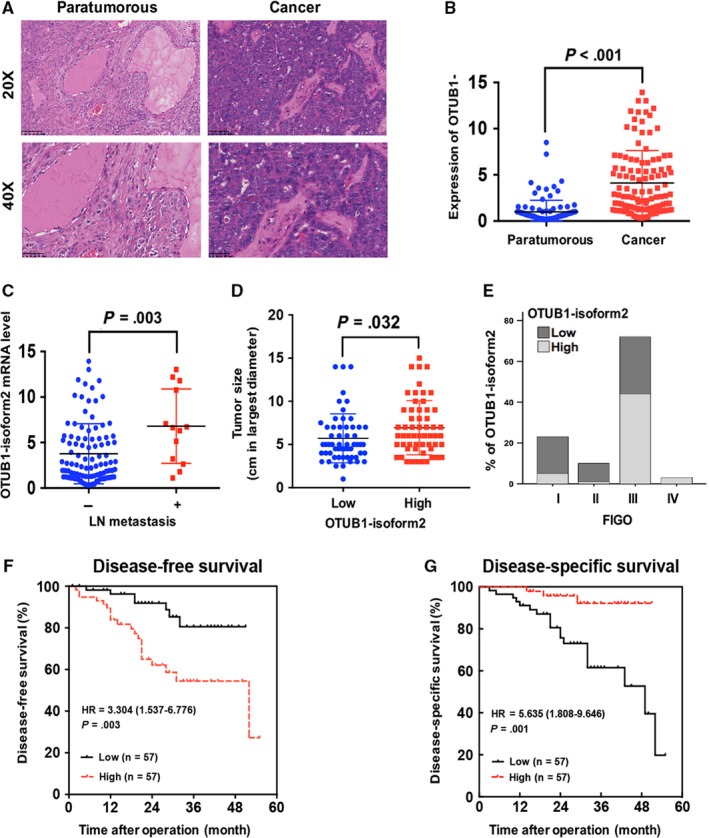
OTUB1‐isoform2 is increased in ovarian cancer tissues and is correlated with poor prognosis. A, The Hematoxylin‐Eosin staining of paratumorous and tumour tissues under the microscope. Up: scale bars = 100 μm. Bottom: scale bars = 50 μm. B, The expression of OTUB1‐isoform2 in paratumorous and ovarian cancer tissues was determined by RT–qPCR. β‐ACTIN was used as an endogenous control to normalize the data. C, The expression of OTUB1‐isoform2 in cases with or without lymph node(LN) metastasis was determined by RT–qPCR. β‐ACTIN was used as an endogenous control to normalize the data. D, The tumour sizes in low and high expression groups of OTUB1‐isoform2 were analysed using Student's t test. The P value was illustrated on the graph. E, The expression of OTUB1‐isoform2 in different FIGO stages was determined by the RT‐qPCR. β‐ACTIN was used as an endogenous control to normalize the data. F‐G, Kaplan‐Meier curves for DFS (F) and DSS (G) of patients with ovarian cancer based on OTUB1‐isoform2 expression
