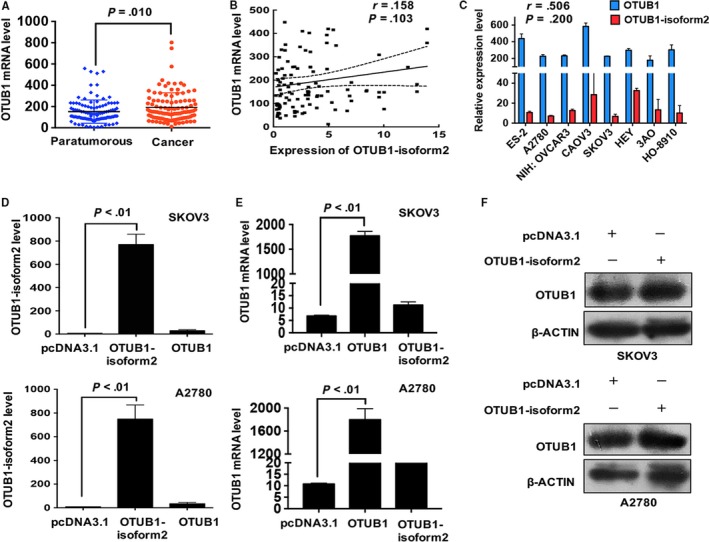
Figure 2.

OTUB1‐isoform2 overexpression is not correlated with OTUB1 expression. A, The expression of OTUB1 in the paratumorous and cancer tissues was determined by RT–qPCR. β‐ACTIN was used as an endogenous control to normalize the data. B, The correlation between OTUB1‐isoform2 expression and OTUB1 expression in the ovarian cancer tissues was evaluated by the Pearson correlation analysis. C, The mRNA expression levels of OTUB1‐isoform2 and OTUB1 in the ovarian tumour cells were evaluated by RT–qPCR. β‐ACTIN was used as an endogenous control to normalize the data. The correlation between the two isoforms in the ovarian tumour cells was evaluated by the Pearson correlation analysis. D, The mRNA expression levels of OTUB1‐isoform2 and OTUB1 in A2780 and SKOV3 cells overexpressing OTUB1 were evaluated by RT–qPCR. β‐ACTIN was used as an endogenous control to normalize the data. E, The mRNA expression levels of OTUB1‐isoform2 and OTUB1 in A2780 and SKOV3 cells overexpressing OTUB1‐isoform2 were evaluated by RT–qPCR. β‐ACTIN was used as an endogenous control to normalize the data. F, The protein expression level of OTUB1 in A2780 and SKOV3 cells overexpressing OTUB1‐isoform2 was evaluated by western blotting; β‐ACTIN was used as a reference. Data are shown as the mean SD of three replicates
