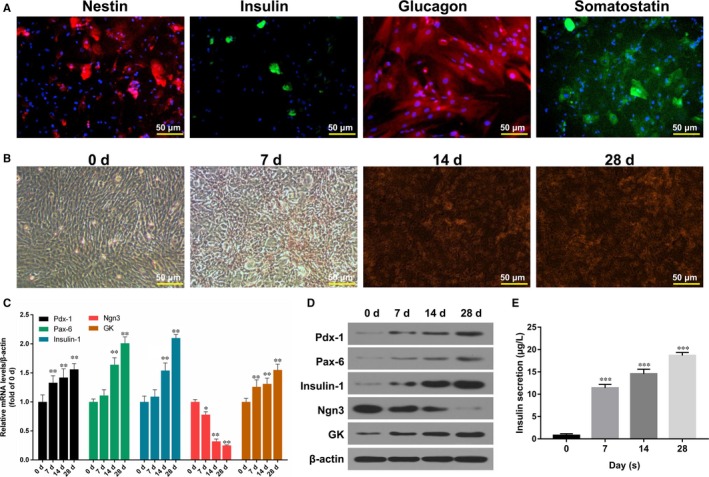
Figure 2.

Differentiation of BMSCs. A, Nestin expression was detected by immunofluorescence assay after 24‐h induction; insulin expression was determined by FITC staining after 7 d induction; glucagon expression was analysed Cy3 staining after inducting for 14 d; somatostatin expression was tested by FITC staining after inducting for 14 d. Magnification: ×20, Scale bar = 50 μm. B, The synthesis of insulin was observed by DTZ staining in BMSCs after inducting for 0, 7, 14 and 28 d, respectively. Magnification: ×20, Scale bar = 50 μm. C, The relative mRNA expression levels of Pdx‐1, Pax‐6, Insulin‐1, Ngn3 and GK were determined by qRT‐PCR assay in BMSCs after inducting for 0, 7, 14 and 28 d, respectively (*P < .05 or **P < .01). D, The protein expression levels of Pdx‐1, Pax‐6, Insulin‐1, Ngn3 and GK were analysed by Western blot assay. E, The production of insulin secretion was measured by radioimmunoassay in BMSCs after inducting for 0, 7, 14 and 28 d, respectively (***P < .001)
