
Figure 1.
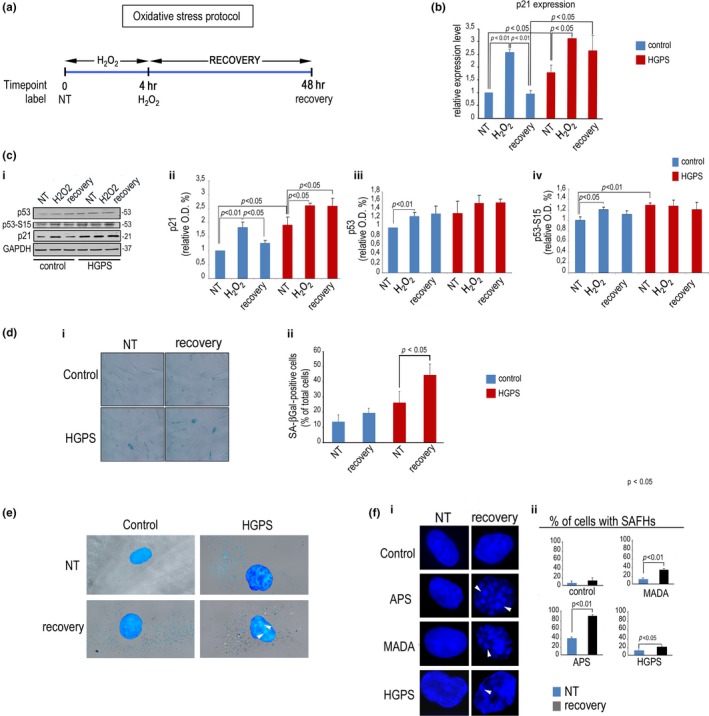
Altered p21 modulation during stress response in HGPS cells. Control or HGPS fibroblasts were left untreated (NT), exposed to H2O2 for 4 hr (H2O2), or harvested after 48 hr of H2O2 recovery (recovery). (a) Sketch of the oxidative stress experiment aligned along the time axis. (b) Quantitative RT‐PCR of CDKN1A expression. (c) (i) Western blot of p53, phospho‐p53 (p53–S15), and p21; (ii) densitometry of p21 bands, (iii) densitometry of p53 bands, and (iv) densitometry of p53–S15 bands; (d) (i) SA‐βGal staining of control and HGPS cells left untreated or after H2O2 recovery; (ii) quantitative analysis of SA‐βGal‐positive cells. (e) SA‐βGal and DAPI co‐staining in normal and HGPS cells showing SAHF (arrowheads). (f) (i) DAPI staining of nuclei of normal, APS, MADA, and HGPS fibroblasts; (ii) percentage of cells with SAHF