
Figure 3.
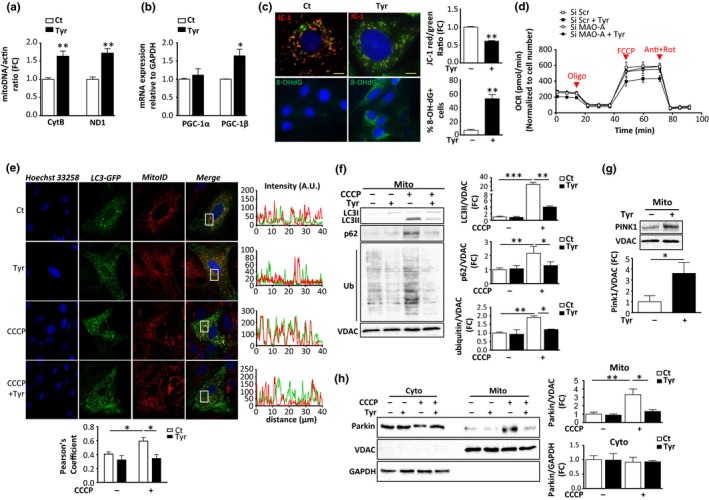
Monoamine oxidase‐A (MAO‐A) activation induces mitochondrial dysfunction and mitophagy impairment. H9C2 cells were stimulated with 500 μM Tyr for 72 hr. (a) mtDNA copy number analysis (Nd1/actin and Cytb/actin) by real‐time PCR (N = 4). (b) Analysis of mRNA levels of PGC‐1α and pGC‐1β normalized to GAPDH by real‐time RT‐PCR (N = 4). (c) Upper panels: JC‐1 aggregates (red)/monomers (green) for mitochondrial membrane potential and quantifications of JC‐1 red/green ratios (N = 4); lower panels: mito8‐OH‐dG immunostaining and quantification of % positive cells (N = 4). (d) Oxygen consumption rate (OCR) measurements in H9C2 cells transfected for 24 hr with siScr or siMAO‐A, then treated for 24 hr with Tyr and recorded 72 hr later. Recording of respiration was done at baseline and after successive addition of oligomycin, FCCP and antimycin A + rotenone. (e) Representative confocal images of LC3‐EGFP‐transfected cells stained with MitoID Red. Cells were treated with 500 μM Tyr for 72 hr, followed by 50 μM CCCP treatment for 6 hr, when indicated. The Pearson's coefficient indexes between LC3‐GFP and mitoID red fluorescence intensities were determined in 10 or more cells from three independent experiments. (f) Analysis of LC3, p62 and ubiquitinated proteins in mitochondrial extracts of H9C2 stimulated with 500 μM Tyr for 72 hr, followed by 50 μM CCCP, when indicated. VDAC was used as a loading control for mitochondria (N = 3). (g) Analysis of pink‐1 by immunoblot in mitochondrial extracts of H9C2 stimulated with 500 μM Tyr for 72 hr. VDAC was used as a loading control (N = 3). (h) Analysis of parkin by immunoblot in cytosolic and mitochondrial extracts of H9C2 cells stimulated with 500 μM Tyr for 72 hr, followed by 50 μM CCCP treatment for 6 hr, when indicated. GAPDH and VDAC were used as loading controls for the cytosolic and mitochondrial fractions, respectively (N = 4). Data are expressed as the mean ± SEM (*p < 0.05, **p < 0.01, ***p < 0.001)