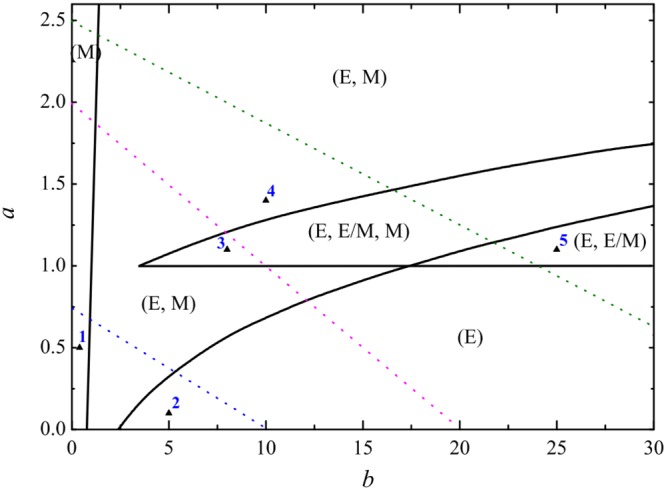
Figure 2.

The phase diagram of deterministic model in the (a, b) parameters plane. The five regions in the phase plane correspond to (M), (E), (E, M), (E, E/M), and (E, E/M, M) states of cancer cell, respectively. The pink dotted line corresponds to one possible EMT process, and the green dotted line corresponds to the other possible EMT process with the increasing of parameter a. The blue dotted line corresponds to a possible MET process with the decreasing of parameter a.
