Fig. 2.
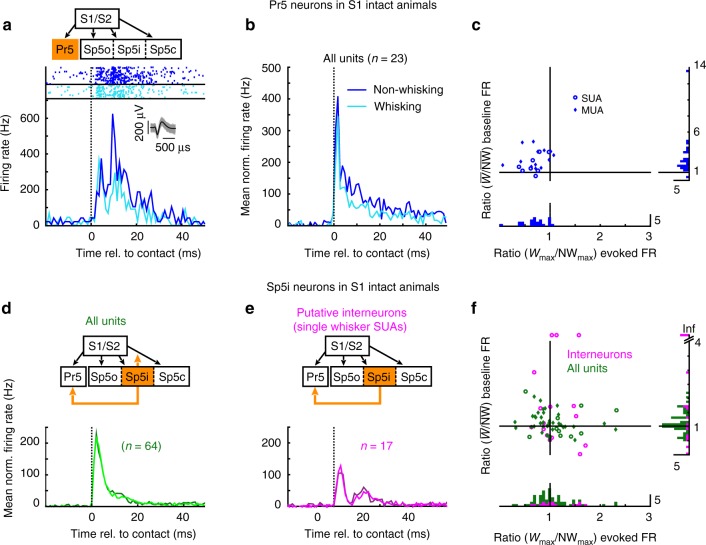
Sensory gating occurs in the brainstem and is pathway-specific. a A representative example of a single unit recorded from the nucleus principalis (Pr5) with rasters and peri-stimulus time histograms (PSTHs) showing contact-evoked responses during whisking (light blue) and non-whisking (dark blue) epochs (bin width: 1 ms). Inset shows the first 1000 spike waveforms (gray) with superimposed median (black). b Population PSTHs (mean across units) of all units, single and multi, recorded from Pr5 normalized to baseline firing rates (20–10 ms pre-contact). Vertical dotted line at zero indicates time of contact. c Scatterplot showing the ratio of mean baseline firing rates between whisking and non-whisking epochs plotted against the ratios of evoked responses (max. firing rate in 10 ms following contact with baseline firing rate subtracted) between whisking and non-whisking (Wmax/NWmax) for all Pr5 units. Same data shown binned as histograms. d, e Population PSTHs, identical to the one shown in b computed for all units recorded from the nucleus interpolaris (Sp5i) shown in green. Of these, only single-whisker-responsive single units were classified as putative interneurons (magenta). Darker colors denote non-whisking trials, whereas lighter colors denote whisking trials. f Scatterplot, identical to c, for all Sp5i units (green) with putative interneurons shown in magenta. Units having a baseline firing rate of zero during non-whisking epochs are shown at the top of the ordinate as having infinite ratios

