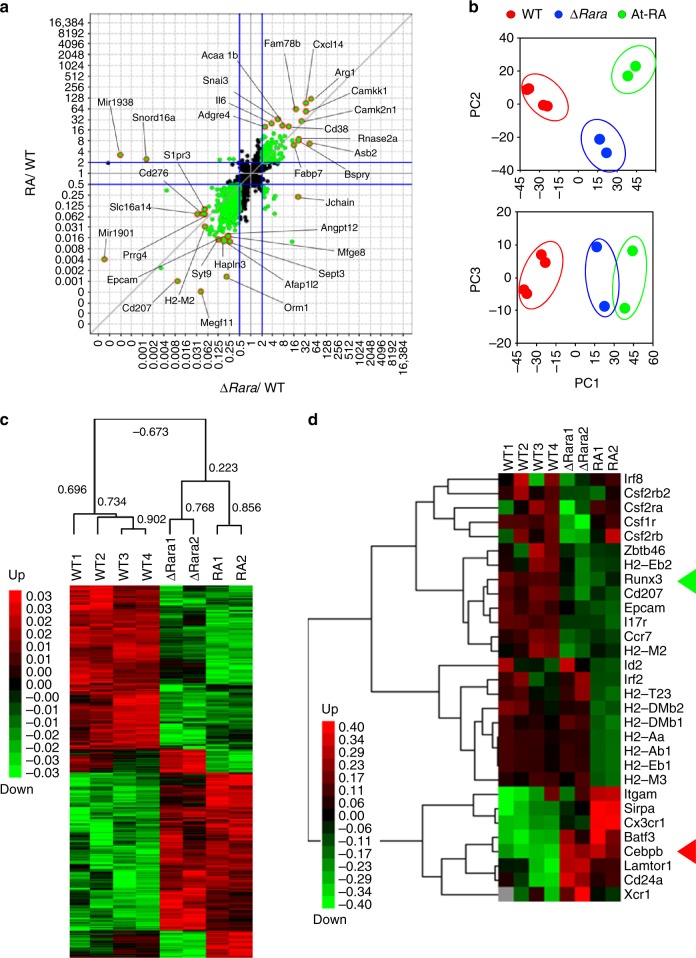
Fig. 4.
The effects of RARα deficiency vs. RA on gene expression in BM-derived DCs cultured in a LC-inducing condition. For all panels in this figure, RNA-seq was performed on WT and ∆RaraCD11c BM cells cultured in charcoal-treated FBS medium containing GM-CSF and TGFβ1 for 3 days. WT cells were cultured with or without At-RA (10 nM). 2–4 independent samples were examined for each group. a Scatter plot analysis of RPKM (Reads Per Kilobase of transcript per Million mapped reads) values for ∆RaraCD11c vs. WT for X-axis and RA vs. WT for Y-axis. 2619 differentially expressed genes were selected based on T-test (P < 0.2) adjusted with Benjamini–Hochberg procedure of the Multiplot Studio (Version 1.5.29, GenePattern). Total 8 samples were examined by RNA-seq (4 WT, 2 ∆RaraCD11c, and 2 At-RA). Genes highlighted in orange are the top 10 up- or down-regulated genes. b Principal component analysis (PCA) of the 2619 selected genes based on their RPKM values. c A Treeview showing hierarchical clustering of 2619 genes commonly or differentially regulated in BM-derived DCs cultured in a LC-inducing condition. Pearson correlation indices are shown. d A Treeview showing hierarchical clustering of manually selected genes from the differentially regulated 2619 genes. The green and red triangles respectively highlight Runx3 and Cebpb genes. Error bars are defined as s.e.m

