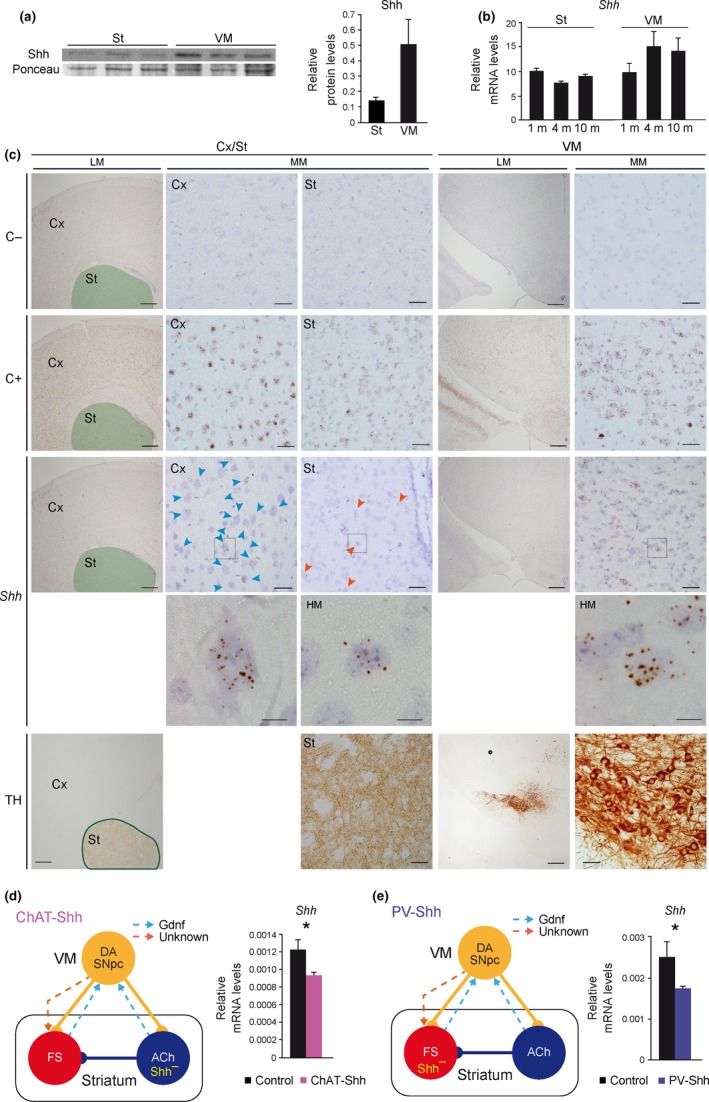
Figure 4.

Cholinergic (ACh) and fast‐spiking (FS) interneurons contribute to striatal Shh production. (a) Shh protein levels by Western blot in striatum (St) and ventral mesencephalon (VM) from three wild‐type 2‐month‐old mice. Total levels of protein were measured by Ponceau staining. (b) Shh mRNA levels measured by qRT–PCR from St and VM of 1‐, 4‐, and 10‐month‐old (m) wild‐type mice. n (1 m) = 6; n (4 m) = 7 (St) and 5 (VM); and n (10 m) = 9 mice per group. (c) Representative coronal sections at cortical (Cx)‐striatal (St; green area in low magnification [LM] images) and VM levels from wild‐type 2‐month‐old mice in situ hybridized with a negative control probe (upper row; C−), a positive control probe (second row; Ppib; C+), and a Shh probe (third row). Low (LM), medium (MM), and high (HM; squares inside MM depicted below) magnification images are shown. In the fifth row, consecutive sections from the same brains have been immunostained with an anti‐TH antibody to identify the regions in situ hybridized in the upper rows. Scale bar: 400 µm in LM, 40 µm in MM, and 10 µm in HM images. (d, e) Left panels, schematic representation of the ChAT‐Shh (d) and PV‐Shh (e) mouse models, where Shh is specifically inactivated (Shh–) in ACh (d) or FS (e) interneurons. Right panels, Shh mRNA levels measured by qRT–PCR from the St of ChatCre/+; ShhloxP/loxP (ChAT‐Shh; d) and PvCre/+; ShhloxP/loxP (PV‐Shh; e) mice. In (d and e), n (d) = 5 control and 4 mutant; n (e) = 6 control and 5 mutant mice per group. In the entire figure, values represent mean ± SEM. *p < 0.05 (Student's t test)
