
Figure 6.
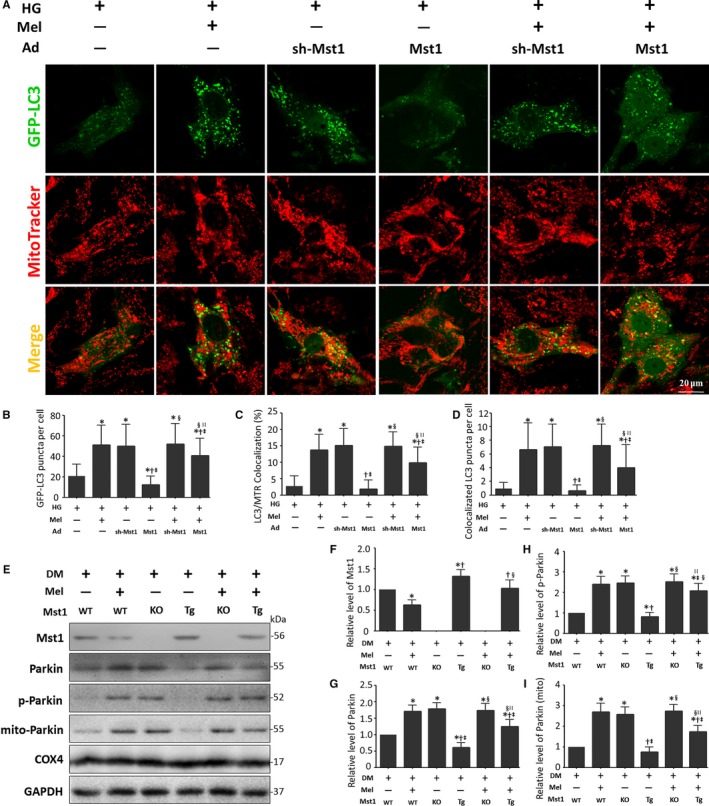
Mst1 as a negative regulator amongst melatonin‐regulated Parkin signaling. A, Representative colocalization images of GFP‐LC3 and mitochondria (MitoTracker Red) (Scale bars: 20 μm). B, Quantitative analysis of GFP‐LC3 punctae per cell. C, Percentage of cells with LC3 and mitochondria (MitoTracker Red, MTR) colocalization. D, Quantitative analysis of GFP‐LC3 puncta colocalization with mitochondria (MitoTracker Red) per cell. The columns and error bars represent the means and standard deviations (SD) (n = 30 cells). *P < 0.05 vs HG; † P < 0.05 vs HG + Mel; ‡ P < 0.05 vs HG + Ad‐sh‐Mst1; § P < 0.05 vs HG + Ad‐Mst1; and || P < 0.05 vs HG + Ad‐sh‐Mst1 + Mel. E, Representative gel blots of Mst1, Parkin, p‐Parkin (Ser65), Mito‐Parkin, COX4 (loading control for mitochondrial protein) and GAPDH (loading control for whole protein). F, Relative levels of Mst1. G, Relative levels of Parkin. H, Relative levels of p‐Parkin. I, Relative levels of Mito‐Parkin. The columns and error bars represent the means and standard deviations (SD) (n = 4). *P < 0.05 vs DM; † P < .05 vs DM + Mel; ‡ P < 0.05 vs DM + Mst1−/−; § P < 0.05 vs DM + Mst1 Tg; and || P < 0.05 vs DM + Mst1−/− + Mel