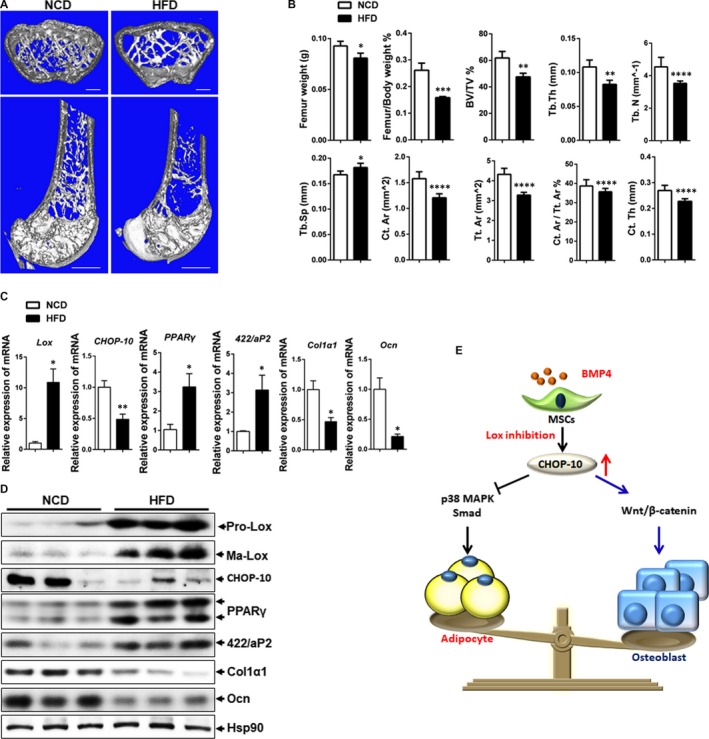
Figure 5.

High‐fat diet mice displayed bone loss accompanied with Lox induction. A, 3D micro‐CT images of cross sections (upper panel) and vertical sections (lower panel) of right femur extracted from NCD mice or HFD mice. Bars: upper panel, 200 μm; lower panel, 1 mm. B, Quantification of trabecular and cortical bone for the same femur as shown in Figure 1A. C, Q‐PCR analysis of Lox, PPARγ, 422/aP2, Col1α1 and Ocn expression in femurs of NCD (n = 5) and HFD (n = 5) mice. D, Western blotting of Lox, PPARγ, 422/aP2, Col1α1 and Ocn expression in femurs of NCD (n = 3) and HFD (n = 3) mice. NCD, normal chow diet; HFD, high‐fat diet. E, Graphical abstract. *P < 0.05, **P < 0.01, *** P < 0.001, ****P < 0.0001
