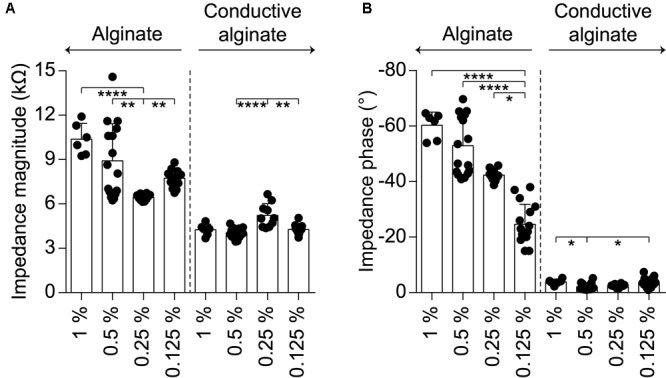
FIGURE 3.

Quantification of the electrochemical characteristics of g-MEA with 400-μm diameter electrodes at different alginate concentrations (1%, n = 6; 0.5%, n = 16; 0.25%, n = 10; 0.125% n = 16); bare alginate on the left and CA on the right. (A) Impedance magnitude at 1 kHz (alginate p < 0.0001, CA p < 0.001, Kruskal–Wallis test with Dunn’s multiple comparisons test). (B) Impedance phase at 1 kHz (alginate p < 0.0001, CA p < 0.01, one-way ANOVA with Tukey’s multiple comparisons test).
