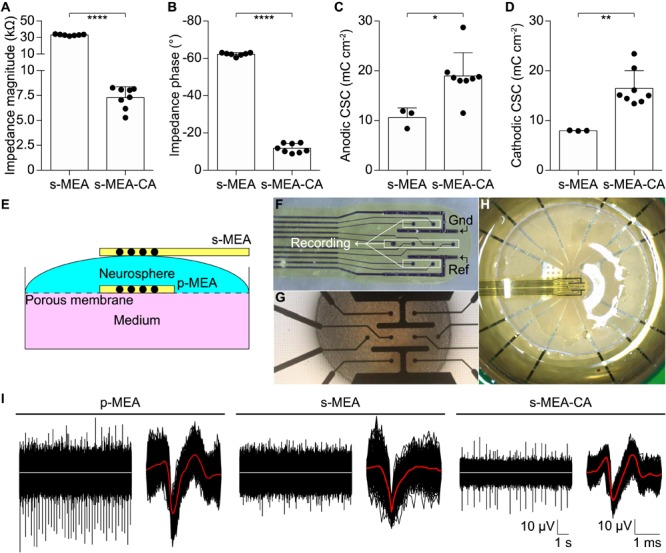
FIGURE 4.

Validation in vitro. (A–D) Quantification of the impedance magnitude at 1 kHz (p < 0.0001, t-test), impedance phase at 1 kHz (p < 0.0001, t-test), anodic CSC (p < 0.05, t-test), cathodic CSC (p < 0.01, t-test) of s-MEA (n = 7 for IS and n = 3 for CV) and s-MEA-CA (n = 8). The electrode diameter is 30 μm. (E) Sketch of the recording set-up. (F) Picture of an s-MEA. (G) Picture of a p-MEA with the NS on top. (H) Picture of the set-up with p-MEA, NS, and s-MEA. (I) Representative recordings from a p-MEA, an s-MEA, and an s-MEA-CA. For each, on the left is a representative raw trace and on the right the overlay of the spike waveform from the same electrode. The white traces represent the baseline (0 μV), while the red lines are the averages of the spike waveforms.
