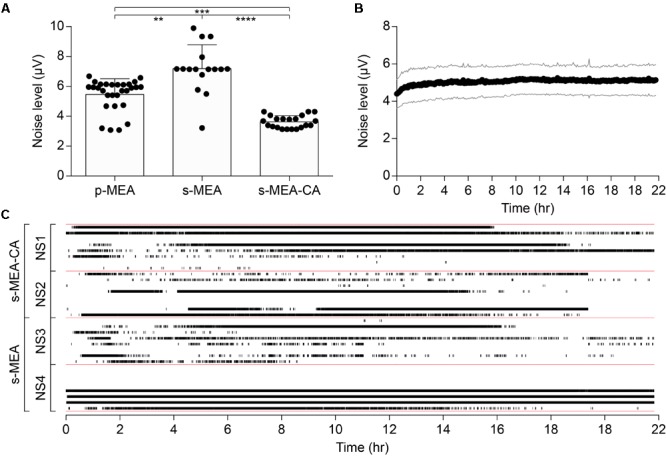
FIGURE 5.

Noise performance of CA-based electrodes. (A) Mean (± SD) of the noise level between p-MEA (n = 29), s-MEA (n = 16), and s-MEA-CA (n = 21); p < 0.0001 Kruskal–Wallis test with Dunn’s multiple comparisons test. (B) Mean (± SD) noise level over the time of s-MEA-CA (n = 21). (C) Spike raster plot of four NSs over 22 h of recordings. s-MEA (two NSs) and s-MEA-CA (two NSs) have eight electrodes each.
