
FIGURE 2.
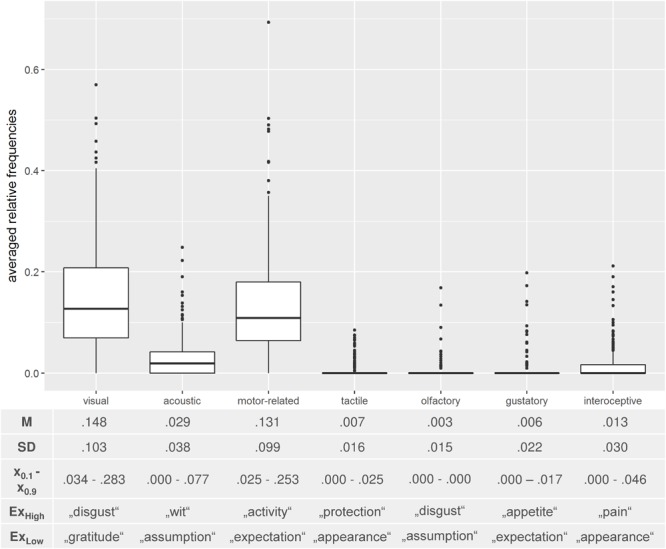
Descriptive statistics of Analysis 2 and corresponding boxplots. M = mean; SD = standard deviation; x0.1/0.9 = first and ninth decile. ExHigh/ExLow depicts exemplary abstract concepts with a high/low portion of generated features in the respective categories.