
FIGURE 3.
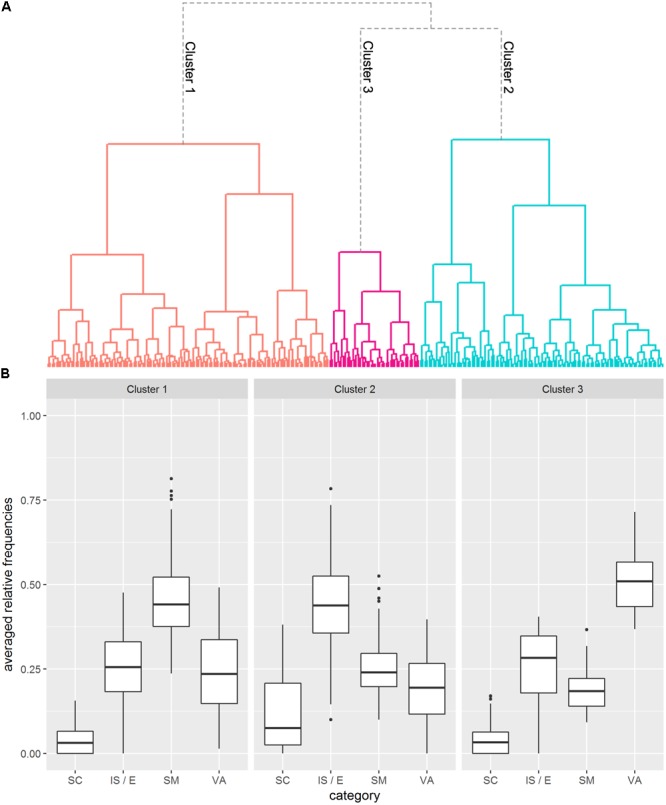
Results of Cluster Analysis 1. (A) Dendrogram visualizing the k = 3 cluster solution. The different clusters are marked by different colors. (B) Boxplots depicting generated features per cluster (SM = sensorimotor feature; IS/E = internal state/emotion; SC = social constellation; VA = verbal association).