
FIGURE 4.
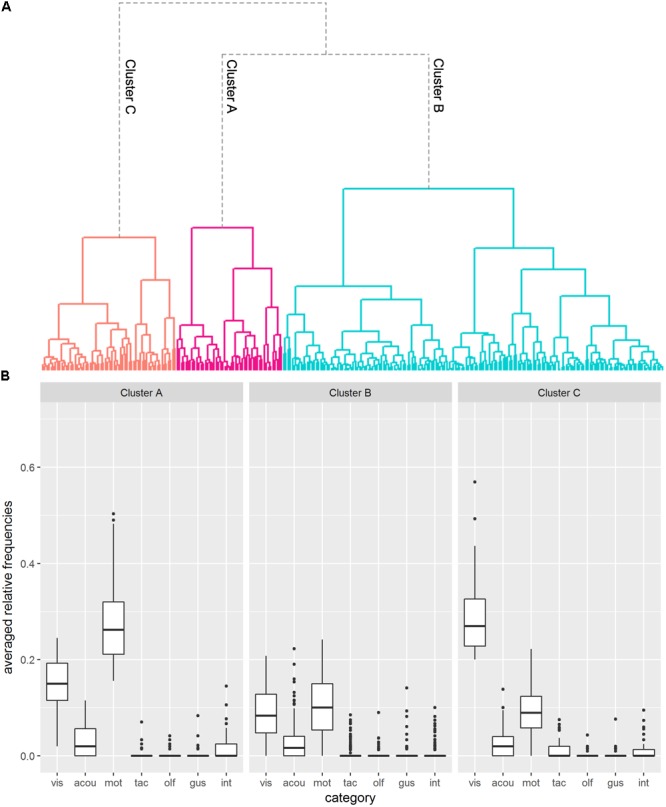
Results of Cluster Analysis 2. (A) Dendrogram visualizing the k = 3 cluster solution. The different clusters are marked by different colors. (B) Boxplots depicting generated features per cluster (vis = visual; acou = acoustic; mot = motor-related; tac = tactile; olf = olfactory; gus = gustatory; int = interoceptive).