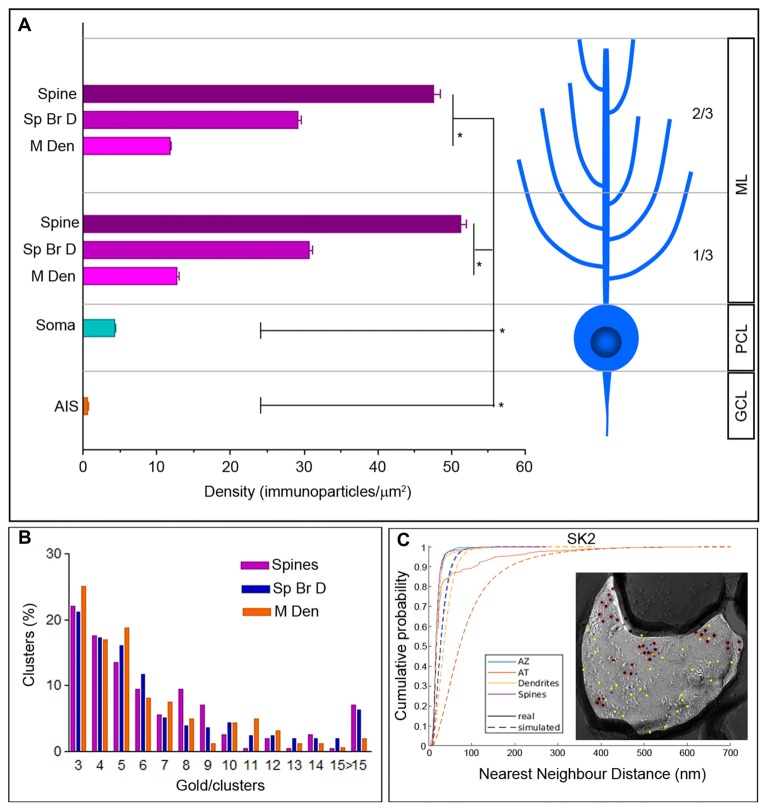
Figure 2.
Density gradient of SK2 immunoparticles in the surface of PCs. (A) Bar graph shows the density (mean ± SEM) of the SK2 channels in eight compartments of PCs. Density of SK2 immunoparticles increased from soma to dendritic spines (soma = 4.31 ± 0.13/μm2; 1/3 ML main dendrite = 12.69 ± 1.96/μm2; 2/3 ML main dendrite = 11.77 ± 0.81/μm2; 1/3 ML spiny branchlet dendrite = 30.67 ± 3.11/μm2; 2/3 ML spiny branchlet dendrite = 29.14 ± 2.69/μm2; 1/3 ML spines = 51.23 ± 2.78/μm2; 2/3 ML spines = 47.60 ± 2.69/μm2; Kruskal–Wallis test, pairwise Mann–Whitney U test and Dunns method, *p < 0.001). Immunoparticle density for SK2 channels on the AISs was not significantly different from the background (AIS = 0.64 ± 0.02/μm2; background = 0.62 ± 0.03/ μm2). ML, molecular layer; PCL, Purkinje cell layer; GCL, granule cell layer. (B) The graph shows the quantification for the number of SK2 particles per cluster in the spines, spiny branchlets (Sp Br D) and main dendrites (M Den). Approximately 76% of clusters in dendritic spines and spiny branchlets and 81% in main dendrites were in the range of 3–8 immunoparticles. (C) Cumulative probability plots of SK2 to SK2 NND. Real and simulated SK2 are shown by solid and dotted lines, respectively. AZ, active zone; AT, axon terminal. The EM image is an example that show random simulation of SK2 immunoparticles in a dendritic spine. Red, real SK2; Yellow, simulated SK2; blue, real Cav2.1.

