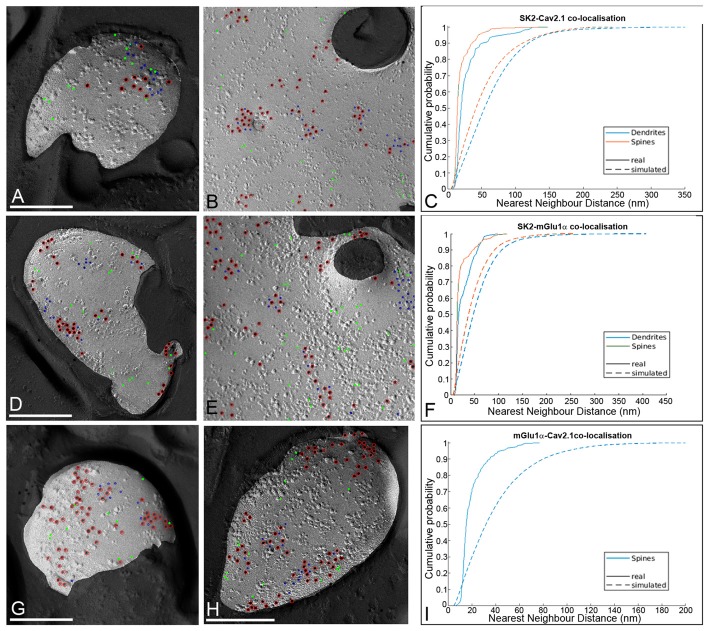
Figure 7.
Spatial relationship between SK2, CaV2.1 and mGlu1α in PCs. (A) Example showing random simulation of immunoparticles for CaV2.1 in a dendritic spine. (B) Example showing random simulation of immunoparticles for CaV2.1 in a dendritic shaft. Red, real SK2; blue, real Cav2.1; green, simulated Cav2.1. (C) Cumulative probability plot of NND from SK2 to CaV2.1 particles in dendrites (blue) and spines (red). Solid: real NND between SK2 and CaV2.1; Dashed: simulated NND. The SK2 to CaV2.1 NNDs were significantly smaller than the random NNDs in dendritic shafts and spines (p < 0.05, pairwise Mann–Whitney U test, numbers of profiles analyzed for spines and dendrites should be indicated). (D) Example showing random simulation of immunoparticles for mGlu1α in a dendritic spine. (E) Example showing random simulation of immunoparticles for mGlu1α in a dendritic shaft. Red, real SK2; blue, real mGlu1α; green, simulated mGlu1α. (F) Cumulative probability plot of NND from SK2 to mGlu1α particles in dendrites (blue) and spines (red). Solid: real NND between SK2 and mGlu1α; Dashed NND: simulated. The SK2 to mGlu1α NNDs were significantly smaller than the random NNDs in dendritic shafts and spines (p < 0.05, pairwise Mann–Whitney U test, numbers of profiles analyzed for spines and dendrites should be indicated). (G,H) Examples showing random simulation of immunoparticles for CaV2.1 in dendritic spines. Red, real mGlu1α; blue, real Cav2.1; green, simulated Cav2.1. (I) Cumulative probability plot of NND between CaV2.1 and mGlu1α particles in spines (blue). Solid: real NND between mGlu1α and CaV2.1; Dashed: simulated. The mGlu1α to CaV2.1 NNDs were significantly smaller than the random NNDs in dendritic spines (p < 0.05, pairwise Mann–Whitney U test, number of profiles analyzed should be indicated).

