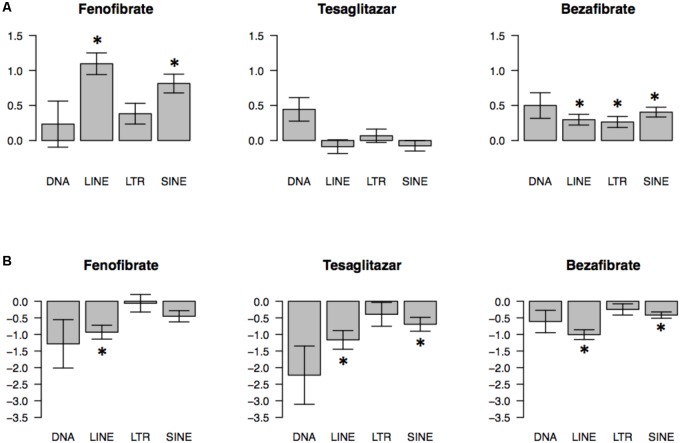
FIGURE 1.
Global effects of PPAR agonists on transcriptomes of 4 classes of transposable elements (TEs) in mouse prefrontal cortex (PFC) (A) and liver (B). Direction and magnitude of PPAR agonist-induced changes were estimated by plotting t distributions for probes that map to a specific TE type. A t-value represents the magnitude and direction of PPAR agonist effects (t < 0 indicates downregulation; t > 0 indicates upregulation by PPAR agonist). The barplots show the average ± SEM t values (∗p < 0.05; based on one-sample t-test comparing average t-values to zero chance with Bonferroni’s correction). N = 7–10 per group.

