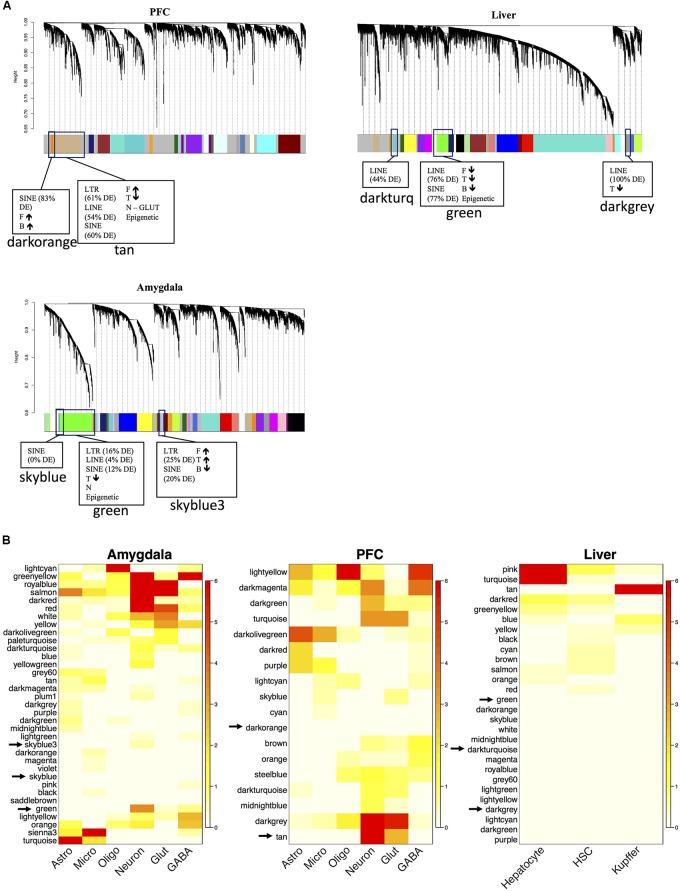
FIGURE 3.
Network analysis of the mouse transcriptome and functional annotation of gene modules after PPAR agonist administration. The dendrogram of the gene network that was constructed for each tissue separately (N = 7–10 per group) (A) The x-axis corresponds to genes detected on the microarray and the y-axis to the co-expression distance between genes determined by the extent of topological overlap. Dynamic tree cutting identified modules, generally dividing them at significant branch points in the dendrogram. Genes in the modules are color-coded. Genes not assigned to a module are labeled gray. The TE-enriched modules are designated by boxes. The adjacent parentheses indicate the percentage of the respective TE class in the module that is differentially expressed (DE). If more PPAR-agonist regulated genes are in the module than expected by chance, it is indicated in the box. The arrows indicate the direction of fold-change induced by the PPAR agonist for the PPAR agonist-regulated genes in that module. F, fenofibrate, T, tesaglitazar, and B, bezafibrate. Heatmap plots of the hypergeometric p-values from the over-representation (enrichment) analysis for the differentially expressed genes (DEGs) and cell type-specific genes (B). Each row in the heatmap corresponds to one module (labeled by color on the left) and each column in the heatmap corresponds to the category being tested for over-representation. Scale bar on the right represents –log(hypergeometric p-values) used to assess statistical significance of over-representation (red, high statistical significance). Rows were arranged by hierarchical clustering. Analysis conducted and graphs made in R.

