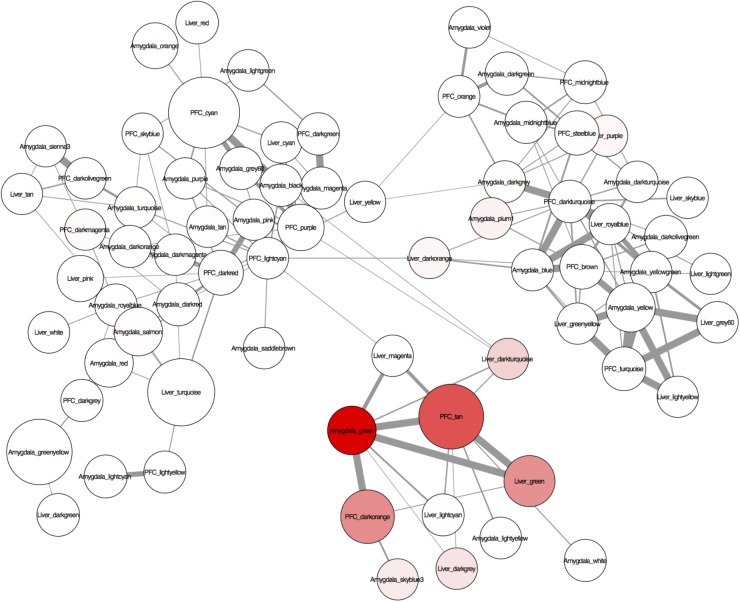
FIGURE 4.
A visualization of the conserved regulation of gene expression networks across the tissues analyzed (liver, amygdala, and PFC) created with Cytoscape 3.2.1. The nodes are modules of the individually constructed networks for each tissue (see Figure 3 for details). Only probes common to all tissues were used to assess module overlap. The edges are the –log(hypergeometric p-values) of the number of overlapping probes between 2 nodes (modules). Edge thickness represents the significance of the overlap between the nodes (modules) – the thicker the line, the more significant the overlap. The nodes (modules) were assessed for enrichment of transposable elements (TEs) and genes differentially expressed at p < 0.05 after systemic treatment with one of 3 PPAR agonists (fenofibrate, tesaglitazar, or bezafibrate) (see methods). Node color represents enrichment with TEs (higher intensity = more enrichment). Node size represents enrichment with PPAR agonist-regulated genes (the larger the node, the more enriched with PPAR agonist-regulated genes).

