Figure 2.

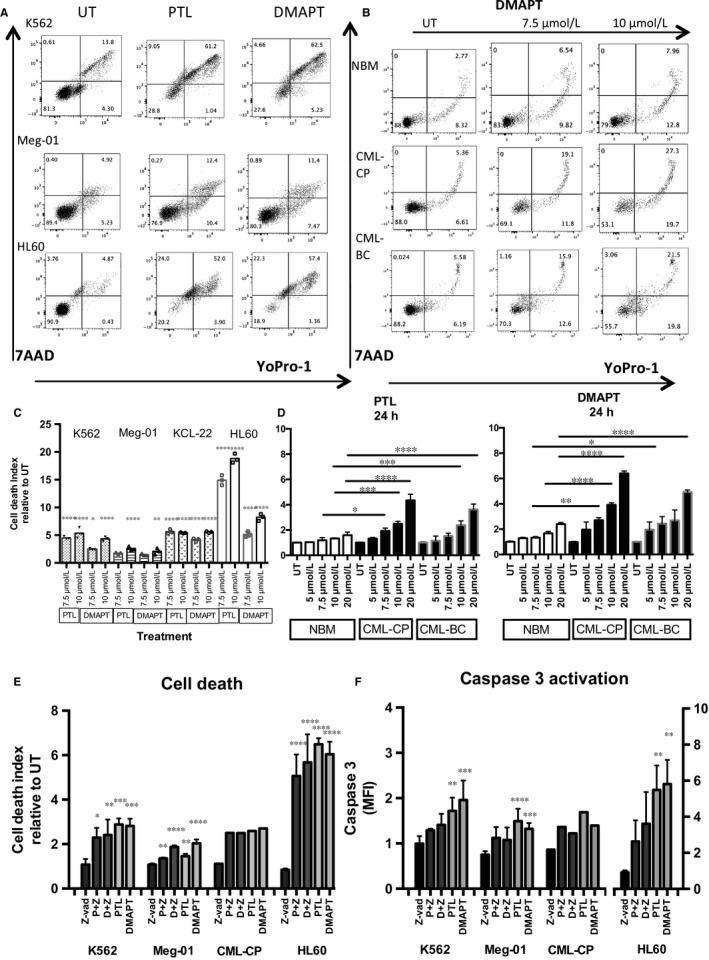
PTL and DMAPT induce cell death in CML cells. Leukaemic cell lines and primary samples from CML patients and normal bone marrow were cultured for 24 h at different concentrations of PTL and DMAPT and the cell death index was analysed. A, Shows flow cytometry plots from K562 and Meg‐01 CML and HL60 AML cell line (used as a positive control). B, Shows representative plots from 3 primary samples (Normal Bone Marrow and CML from a chronic phase and a blast crisis patient). ex in Untreated conditions or exposed to 7.5 or 10 μmol/L of DMAPT. Lower and left arrows indicate fluorochrome stain, Upper arrow indicates DMAPT concentration. C, Represents the cell death index detected in K562, Meg‐01, KCL‐22 and HL60 cell lines and D Indicates the average of 3 replicates with primary samples from normal bone marrow (NBM), CML Chronic Phase (CML‐CP) and CML Blast Crisis (CML‐BC) mononuclear cells. E, Represents the cell death index increase (YoPro‐1 and Propidium Iodide) in cells from cell lines and a CD34+ enriched CML‐CP primary sample, pre‐treated with the pan‐caspase inhibitor Z‐vad and PTL or DMAPT. F, Shows the activation of Caspase‐3 after pre‐treatment with Z‐vad and treatment with PTL or DMAPT for 24 h. Cell death index was determined by dividing the frequency of dead cells in PTL or DMAPT treated cells by the frequency of dead cells detected in untreated group, (considered as 1). Significance between cell death index in UT and treated in cell line experiments was determined by Dunnet's multiple comparison test and between NBM treated and CML treated cells was determined by Tukey's multiple comparison test. *P < .05 **P < .01, ***P < .001, ****P < .0001
