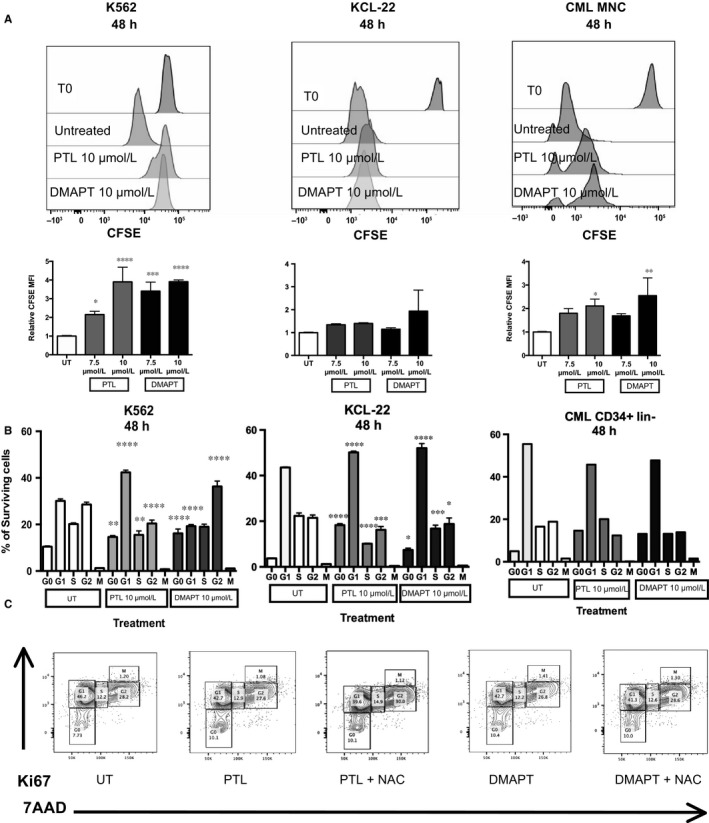
Figure 6.

PTL and DMAPT delay cell proliferation and induce an arrest in G0 cell cycle phase in a mechanism independent of ROS induction. Leukaemic cell lines were cultured in the absence or presence of 7.5 and 10 μmol/L to PTL and DMAPT for 48 h, surviving cells were obtained by ficoll‐paque and selected as 7AAD negative cells. CFSE content and cell cycle status was analysed by flow cytometry. Results in (A) show a representative histogram of CFSE level after PTL or DMAPT treatment as well as MFI before treatment. The MFI values from 3 experiments are plotted below. (B) indicates a representative plot of cell cycle distribution and the average of cell cycle phases. In the case of C, the cells were pre‐treated with NAC for 1 h and then cultured with PTL and DMAPT for 48 h. The result shows a representative histogram of tree different replicates. Significance between UT and treated cells in proliferation assay was determined using an unpaired Student t‐test. Significance between Cell cycle phase was determined using Tukey's multiple comparison test. *P < .05 **P < .01, ***P < .001, ****P < .0001
