
Figure 4.
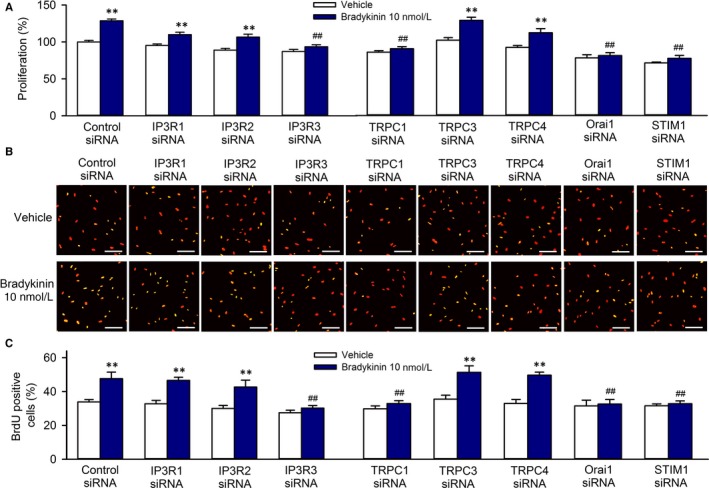
Effects of silencing IP3Rs or components of SOCE channel on cell growth and migration induced by bradykinin (BK). A, Cell proliferation determined with MTT assay in cells transfected with 40 nmol L−1 siRNAs targeting IP3R1, IP3R2, IP3R3, TRPC1, TRPC3, TRPC4, Orai1 or STIM1 in the absence or presence of 10 nmol L−1 bradykinin. B, Images of BrdU incorporation in cells transfected with 40 nmol L−1 siRNAs targeting IP3R1, IP3R2, IP3R3, TRPC1, TRPC3, TRPC4, Orai1 or STIM1 in the absence or presence of 10 nmol L−1 bradykinin. The proliferative cells show yellow colour from the merging of BrdU green staining with Propidium Iodide (PI) red nuclei staining. C, Percentage values of BrdU incorporation in cells transfected with 40 nmol L−1 siRNAs targeting IP3R1, IP3R2, IP3R3, TRPC1, TRPC3, TRPC4, Orai1 or STIM1 in the absence or presence of 10 nmol L−1 bradykinin. N = 5 experiments, **P < .01 vs control siRNA, ## P < .01 vs control siRNA with 10 nmol L−1 bradykinin