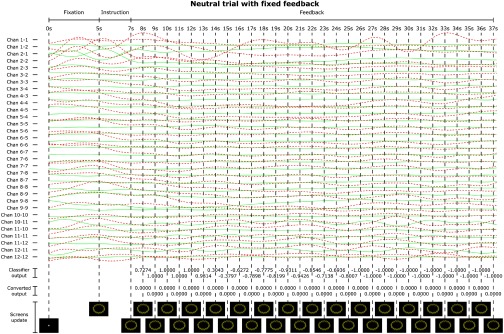
Fig. 10.
Example of signal traces from subject 8 during a neutral trial with fixed feedback, including the classifier output from each moving window and the converted output according to the respective feedback condition. Continuous green and dotted red lines represent HHb and concentrations, respectively.

