
Fig. 3.
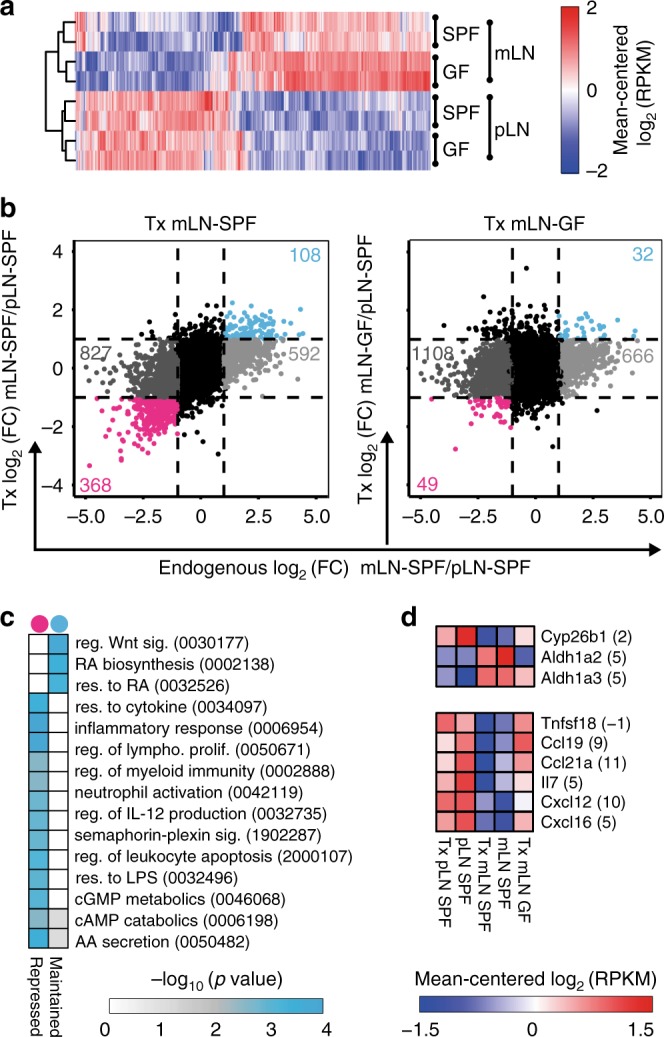
Location-specific transcriptional signatures of mLN FSCs are imprinted by microbiota. a CD45−Ter119−CD31−gp38+ FSCs were isolated from mLNs and pLNs of GF or SPF mice, and RNA-seq and subsequent analysis was performed. DEGs were identified in colonization-dependent (SPF vs. GF) and location-dependent (mLNs vs. pLNs) pairwise comparisons (|log2(FC)| ≥ 1 and q-value ≤ 0.05). Heatmap represents 1411 DEGs. Mean-centered log2(RPKM) values are depicted. Data pooled from two independent experiments. b CD45−CD24−CD31−gp38+ FSCs were isolated from endogenous mLN-SPF and pLN-SPF, transplanted pLN-SPF and mLN-SPF or transplanted mLN-GF. RNA-seqL and subsequent analysis was performed. Colored numbers in scatterplots represent DEGs (|log2(FC)| ≥ 1 and q-value ≤ 0.05) for the pair-wise comparisons of FSCs. On the x-axis log2(FC) of gene expression from FSCs (endogenous LNs) is plotted. (left) On the y-axis log2(FC) of gene expression from FSCs from transplanted mLN-SPF vs. pLN-SPF is plotted. (right) On the y-axis log2(FC) of gene expression from FSCs from transplanted mLN-GF vs. pLN-SPF is plotted. Data pooled from two to four independent experiments (n = 3–8). c GO analysis of biological processes of genes persistently up-regulated (Maintained, blue dot) or down-regulated (Repressed, pink dot) in FSCs of transplanted mLN-SPF. d Heatmaps of expression of genes involved in RA metabolic process or of soluble mediators within FSCs from indicated groups. Numbers in brackets indicate average log2(RPKM) expression of respective genes across all experimental groups. Data pooled from two to four independent experiments (n = 3–8). DEG differentially expressed genes, AA amino acid, FC fold-change, FSC fibroblastic stromal cells, GO gene ontology, RA retinoic acid, reg. regulation, res. response, RPKM reads per kilobase of exon length per million mapped reads, sig. signaling