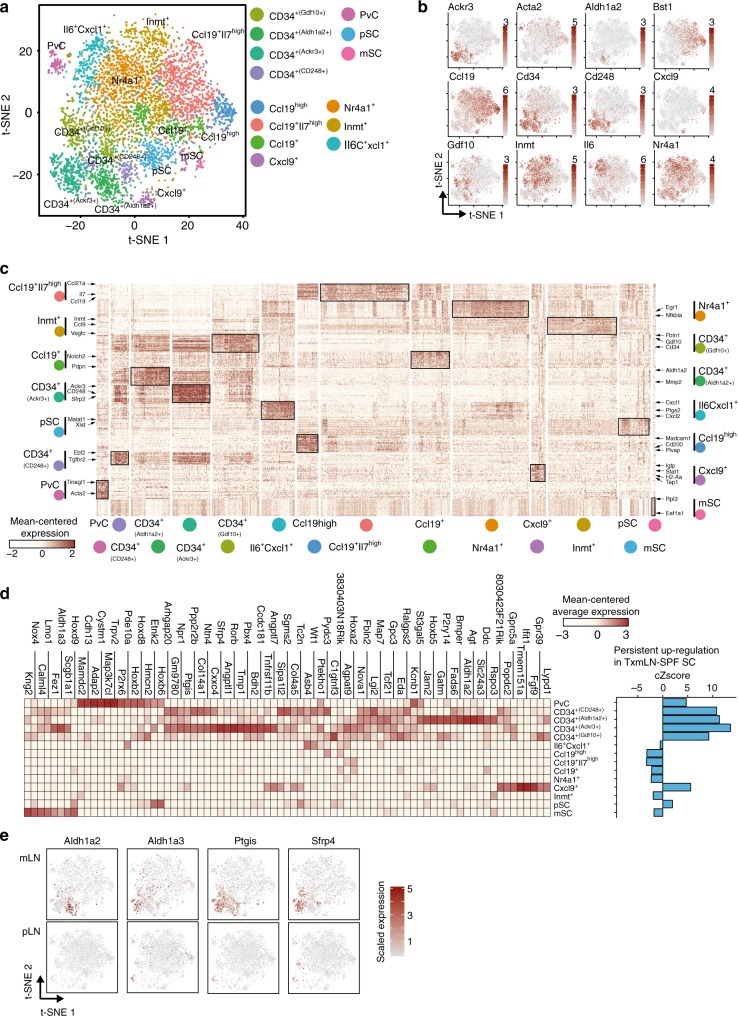
Fig. 4.
Location-dependent features are imprinted within selected SC subsets. Single cell suspensions from mLNs and pLNs were sorted for CD24−CD45− cells and subjected to scRNA-seq. Non-endothelial SCs were identified as non-LECs, non-BECs, and Pecam1− and Ackr4−. Data pooled from two independent experiments. a t-SNE plot of merged pLN SCs and mLN SCs showing cluster segregation. b Expression of subset-defining DEGs across all non-endothelial SCs on t-SNE plot. c Heatmap of 272 DEGs (up to 20 per cluster) with the most significant differential expression (minimal FDR-adjusted p-value). Marker genes for respective clusters are indicated with arrows. d Heatmap (left) depicts average expression per cluster of genes persistently up-regulated in SCs from transplanted mLN-SPF. Bargraph (right) shows cumulative Z-score (cZscore) of average expression per cluster for the genes persistently up-regulated in SCs from transplanted mLN-SPF. e Expression of indicated genes persistently up-regulated in non-endothelial SCs from transplanted mLN-SPF on t-SNE plot for mLN-SPF and pLN-SPF scRNA-seq. BEC blood endothelial cell, DEG differentially expressed gene, mSC metabolic stromal cells, pSC proliferating stromal cells, PvC perivascular cells, SC stromal cell, LEC lymphatic endothelial cell, t-SNE t-distributed stochastic neighbor embedding

