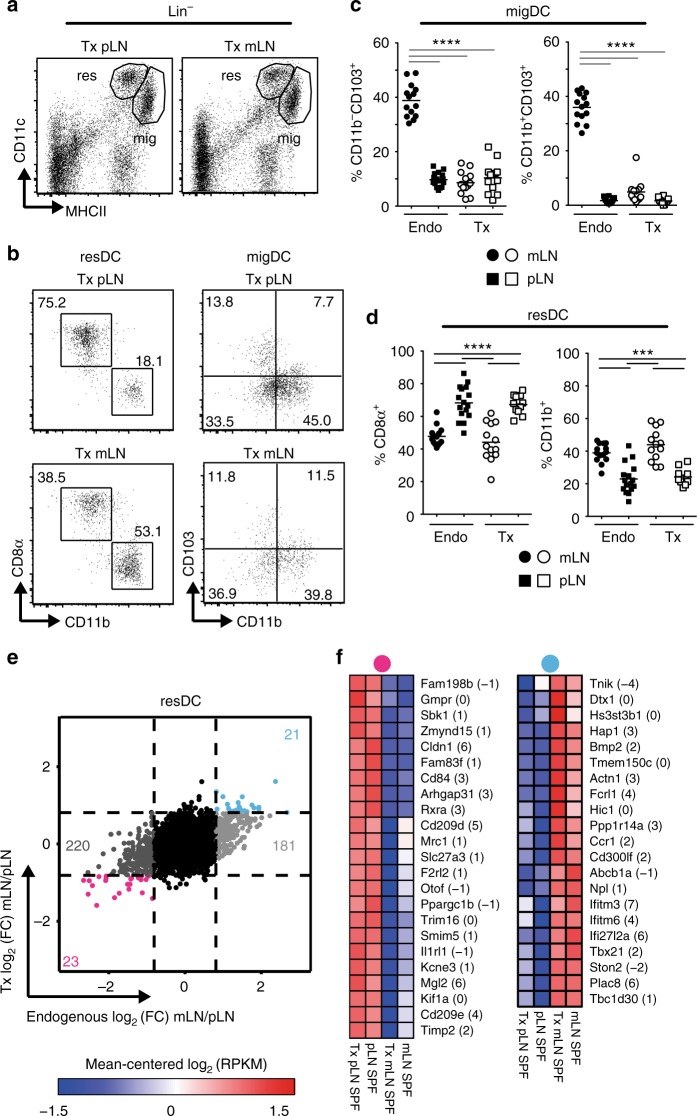
Fig. 5.
mLN SCs modulate subset composition and transcriptional signature of resident DCs. Indicated LNs were transplanted to the popliteal fossa of SPF-housed mice. Eight to sixteen weeks later, single cell suspensions were generated by enzymatic digestion. a–d Single cell suspensions were analyzed using flow cytometry. a Exemplary dotplot of viable Lin− cells from transplanted LN. (b) Exemplary dotplot of subsets from resDCs and migDCs from indicated LNs. c–d Scatterplot shows frequencies of indicated subsets among migDCs (c) and resDCs (d); data pooled from two to three independent experiments (n = 12–16). e resDCs were isolated from indicated LNs. RNA-seqL and subsequent analysis was performed. Colored numbers in scatterplots represent DEGs for the respective pair-wise comparisons of resDCs (|log2(FC)| ≥ 1 and q-value ≤ 0.05). On the x-axis log2FC of gene expression from resDCs (endogenous LNs) is plotted. On the y-axis log2(FC) of gene expression from resDCs of transplanted mLN-SPF vs. pLN-SPF is plotted. f Heatmap of expression of genes persistently down- (pink dot, left) or up-regulated (blue dot, right) in resDCs isolated from transplanted mLN-SPF. Numbers in brackets indicate average log2(RPKM) expression of respective genes across all experimental groups. Data pooled from two to three independent experiments (n = 3–8). migDC migratory dendritic cell (Lin−CD11c+MHCIIhigh), resDC resident dendritic cell (Lin−CD11chighMHCII+), Lin CD3+CD45R+Ly6G+F4/80high, FC fold-change, RPKM reads per kilobase of exon length per million mapped reads, Endo endogenous, Tx transplanted

